
wMAR & reference periods
Advanced view explained: the base and reference period pair, the Base Weight slider, wMAR, Relation, and the paired threshold filters.
Advanced view measures every strategy over two windows instead of one: a shorter base period and a longer reference period. Everything it adds — wMAR, Relation, the paired columns and threshold sliders — exists to answer one question: is this strategy's recent behaviour consistent with its longer-term record, or is the headline number coming from one good stretch?
Switch it on with the Advanced button in the Period Configuration header. Nothing about your plan or permissions changes; see Strategy Browser for the difference between the two views.
The same switch also changes what the
Deep Dive panel measures, and reveals
two Portfolio Builder surfaces — the
MAR < 1.00 chip and the
Risk Contribution panel.
The two periods
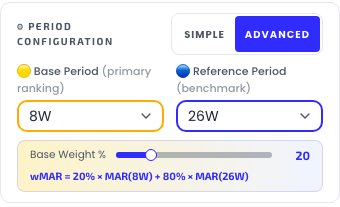
Advanced view splits the single Period selector into two:
- 🟡 Base Period (primary ranking) — the shorter, more recent window. Defaults to 8W (trailing 40 trading days).
- 🔵 Reference Period (benchmark) — the longer window you measure the base against. Defaults to 26W (trailing 130 trading days).
Both selectors offer the same choices as the Simple view's single selector — rolling windows (1W–52W) and calendar periods (1M–24M, Total). How the two kinds differ is covered in Period, scope & variants.
Those defaults are not arbitrary. They come from a forward-test study across the full four-year walk-forward: a medium base, a long reference and a low base weight was the region that held up out of sample. Both are rolling windows, so the pairing does not trigger the rolling-vs-calendar mismatch warning.
Mixing kinds is allowed but flagged. If you set a rolling base against a calendar reference (or vice versa), the period banner raises a warning — rolling windows count trailing trading days up to the latest data, while calendar periods use completed months and skip the current partial one. Similar spans like 12W and 3M are measured differently and can legitimately disagree.
The Base Weight slider
Directly under the two selectors sits Base Weight % — a slider from 0 to 100 in steps of 5, defaulting to 20.
It sets how much the base period counts toward the blended metric. The panel prints the live formula beneath it, so the number is never a black box:
wMAR = 20% × MAR(8W) + 80% × MAR(26W)
At the default, recent performance carries a fifth of the weight and the long-term benchmark carries four fifths. Drag it to 0 and wMAR collapses to the reference period's MAR alone — which is exactly what the Simple view shows you. Drag it to 100 and only the base period counts.
wMAR
wMAR (weighted MAR) is the blend the slider defines. MAR itself is CAGR ÷ Max Drawdown over a window — return earned per unit of drawdown — so wMAR is that same ratio computed for each of your two periods and combined at the weight you chose.
The column header carries the formula as a tooltip, with your current periods and weight substituted in, and it ends with the property that matters most:
Weighted MAR: wMAR = 20% × MAR(8W) + 80% × MAR(26W). MAR = CAGR ÷ Max Drawdown over the window. Recomputable from the MAR Base and MAR Ref columns.
Recomputable is the point. wMAR is not a proprietary score — both inputs sit in adjacent columns and the weight is on screen, so you can reproduce any wMAR in the table by hand. Nothing is hidden inside it.
Two limits worth holding onto:
- wMAR never sorts the catalog unless you ask it to. The default sort is MAR over the reference period — a raw statistic, not a blend.
- A blend can hide its own inputs. Two strategies with identical wMAR can be built very differently: one steady across both windows, one weak recently and strong historically. That is what the Relation column is for.
Relation
Relation is MAR Base ÷ MAR Ref — recent performance divided by the long-term benchmark. Above 1 means the recent window is stronger than the reference window; below 1 means weaker.
The cell colouring, per the column's own tooltip: green above 1.02, coral below 0.98, grey in between.
Relation is the honest counterweight to wMAR. wMAR tells you how good the blend looks; Relation tells you whether the two halves agree. A high wMAR with a Relation far from 1 is a strategy whose two windows disagree — worth understanding before it goes into a portfolio.
What the banner shows

Simple view shows one 🔵 PERIOD pill. Advanced replaces it with three:
- 🟡 BASE — the base window and its length in trading days
- 🔵 REF — the reference window and its length
- 📐 RELATION — a reminder of what the ratio means: Base / Ref · >1 means recent > long-term
📅 DATA THROUGH appears in both views and is the last trading day reflected in what you are seeing. The catalog is rebuilt weekly, so a date a few days back is normal.
The extra columns
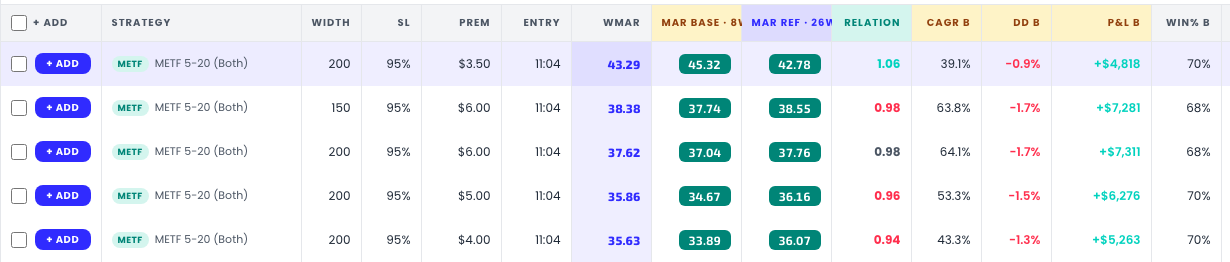
Advanced renames the shared columns and adds period-specific ones. The base columns are tinted amber and the reference columns blue, matching the selectors.
| Column | What it is |
|---|---|
| wMAR | The weighted blend described above |
| MAR Base · 8W | MAR over the base period — the primary ranking window |
| MAR Ref · 26W | MAR over the reference period. This is the column Simple view labels plainly MAR |
| Relation | MAR Base ÷ MAR Ref |
| MAR / BP | Capital efficiency: MAR per $1,000 of buying power, where BP = (width − premium) × 100 |
| CAGR B · DD B · Win% B · Sharpe B · Sortino B · P&L B · Trades B | The base-period twin of each metric |
| CAGR R · DD R · Win% R · Sharpe R · Sortino R · P&L R | The reference-period twin |
Every metric definition is in Metrics & columns — Advanced changes which periods they are computed over, not what they mean.
Not everything extra is on by default. The reference twins and MAR / BP start hidden even in Advanced; the Columns picker turns them on. Advanced also lets you reorder columns, which Simple does not.
Paired thresholds
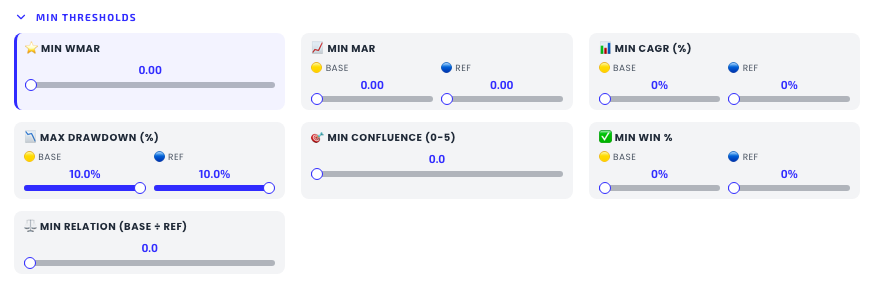
The Min Thresholds panel gains a second dimension. Where Simple offers one slider per metric, Advanced offers a 🟡 Base and 🔵 Ref pair, so you can require a floor in each window independently:
| Threshold | Simple | Advanced |
|---|---|---|
| ⭐ Min wMAR | — | 0–80 |
| 📈 Min MAR | — | Base + Ref pair, 0–50 |
| 📊 Min CAGR (%) | single Ref slider | Base + Ref pair, 0–80 |
| 📉 Max Drawdown (%) | single Ref slider | Base + Ref pair, 0–10 |
| ✅ Min Win % | single Ref slider | Base + Ref pair, 0–100 |
| ⚖️ Min Relation (Base ÷ Ref) | — | 0–5 |
| 🎯 Min Confluence (0-5) | 0–5 | 0–5 (unchanged) |
Requiring a floor in both windows is the strictest and most useful filter here: it asks for strategies that were solid recently and over the long run, rather than either one alone.
Switching back to Simple resets the advanced-only thresholds to their defaults. That is deliberate — a Min wMAR you set in Advanced would otherwise keep filtering the catalog with no visible control to explain why the table looks thin.
Related pages
Get the weekly 0DTE research email
Research notes and product updates, straight to your inbox. Unsubscribe anytime.