
The composition table
Every column and control of the composition table: contract steppers, enable/disable, aliases, correlation flags, family groups and the totals row.
The composition table is where you shape the portfolio: how many contracts of each strategy, which stay enabled, and which are pulling their weight.
The toolbar

- Filter strategies… — case-insensitive text filter over names and ids.
- Correlated > (slider) — the correlation threshold (adjustable 0.40–0.95). Strategies whose daily returns correlate with another pick above this value get flagged in the table. Higher = stricter.
- Correlated only (n) — narrows the table to just the flagged rows so you can review them and decide what to drop. Nothing is removed automatically.
- Columns — show, hide and drag-reorder columns; the layout is remembered per device. Performance columns carry a badge with the active period.
The columns
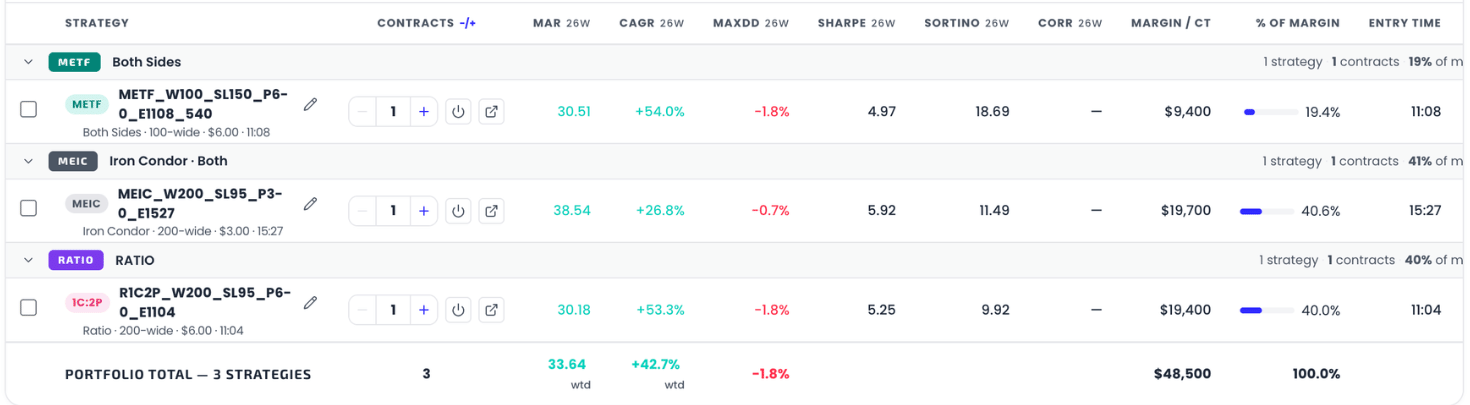
| Column | Meaning |
|---|---|
| Strategy | Family badge, name (or your alias), and the parameter summary underneath. |
| Contracts −/+ | Per-strategy sizing: the steppers scale this strategy's allocation (1–999). |
| MAR | This strategy on its own: CAGR ÷ Max Drawdown, on the standardized $100k account, over the active period. |
| CAGR | Compound annual growth of the strategy on its own, standardized. |
| MaxDD | The strategy's own worst peak-to-trough decline, as % of the standardized account. |
| Sharpe / Sortino | Risk-adjusted return per unit of total / downside volatility. |
| Corr | The strategy's highest correlation with any other enabled pick — values above the threshold render in coral with a badge listing the partners. |
| Margin / ct | Margin per contract: (width − premium) × 100 — the spread's max loss. |
| % of margin | This row's share of the portfolio's total deployed margin, drawn as a bar. |
| Entry Time | The strategy's entry time (via Columns you can also show Width, Stop Loss, Premium and EMA Variant as separate columns). |
Per-strategy ratio metrics (MAR, CAGR, MaxDD, Sharpe, Sortino) are contract-invariant: they describe the strategy, not your sizing. What scales with your contract counts: total margin, total P/L, and margin share.
Row controls
- −/+ steppers — size the allocation.
- Power toggle — disable a strategy without deleting it: the row gets an OFF badge, is excluded from every aggregate, and keeps its place for later re-enabling. Useful for A/B-ing a construction.
- Pencil — give the strategy your own alias (prefix, suffix, comment).
- ✕ — remove the row entirely.
MAR < 1.00chip — a neutral marker on rows below that threshold. See below.
The MAR < 1.00 chip
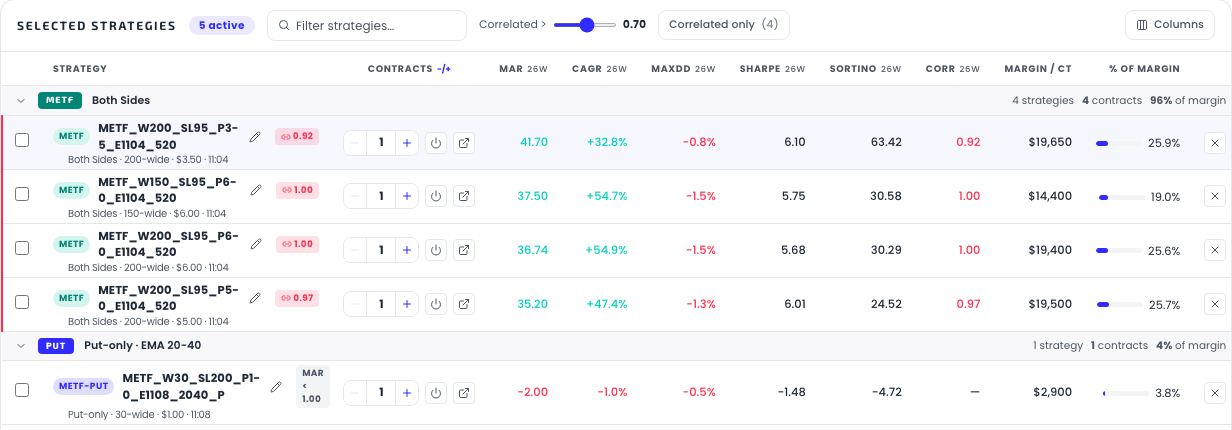
In Advanced view, a small grey chip reading
MAR < 1.00 appears on any enabled row whose MAR over the period you have
selected is below 1.00. Hovering it gives the whole story:
This strategy's MAR over the selected period is −2.00, below the fixed 1.00 mark used to flag rows here. The same threshold applies to every user and every strategy. Shown for information only — it is not a recommendation to remove or keep anything.
What it is: a statement that one number crossed one line. Nothing more.
- The threshold is fixed at 1.00 and identical for every user and every strategy. It is not derived from your account size, your portfolio, or any other attribute of yours.
- It reads the plain MAR for your selected analysis period — not wMAR, and not a blend. Change the period and the chip can appear or disappear, because the underlying number changed.
- It is deliberately neutral in colour — grey, like the
OFFchip — and it does not tint the row. That is a design decision, not an oversight: a warning colour would be a verdict on the holding rather than a fact about it. - It does not appear in Simple view, on disabled rows, or anywhere in the portfolio's aggregates. It changes no calculation.
What it is not: it is not advice, and it is not a signal to remove anything. MAR below 1.00 means the strategy returned less than its own maximum drawdown over that window — informative, and on its own not a reason to do anything. A strategy can sit below 1.00 and still earn its place in a portfolio (for example by being uncorrelated with the rest of your book — see Analytics charts). What you do with the information is your call.
The Format switch
The Format switch button in the Builder header (the wand icon) changes the nomenclature strategies are named in — it changes nothing about the strategies themselves, your sizing, or any number on the page. Two options:
- CashFlow Engine naming (default) — descriptive:
Iron Condor · 50-wide · $2.25 · 11:59. Self-explanatory, longer. - Rob's format (ROPS) — the compact community shorthand:
600-M-95-200-00encodes premium ×100, the gate, stop-loss, and width. Terse, and what you want if you're comparing notes with people who speak it.
Flip it and the strategy names in the table (and the id/subtitle underneath) re-render in the chosen convention.
It follows you into exports. Whatever the Format switch is showing at the moment you export is the naming that lands in the file — including the OptionsApp export and the Excel workbook. If you want Rob-format names in a spreadsheet you're about to share, flip the switch before you export (the Excel export also asks you directly — see Excel & Native Portfolio).
Family groups and the footer
Rows group by strategy family (METF, Put-only, Call-only, Iron Condor, Ratio, Imported), each group collapsible, with contracts and margin share summarized per family.
The sticky Portfolio total footer shows: total contracts, the margin-weighted average MAR and CAGR (marked wtd), the worst per-strategy drawdown, total netted margin, and 100% margin share. Note the wtd numbers are weighted averages of the parts — the compounded portfolio numbers, which stack gains across strategies, live in Portfolio Metrics and are typically different.
Get the weekly 0DTE research email
Research notes and product updates, straight to your inbox. Unsubscribe anytime.