
BlueprintUpdated
Portfolio Metrics
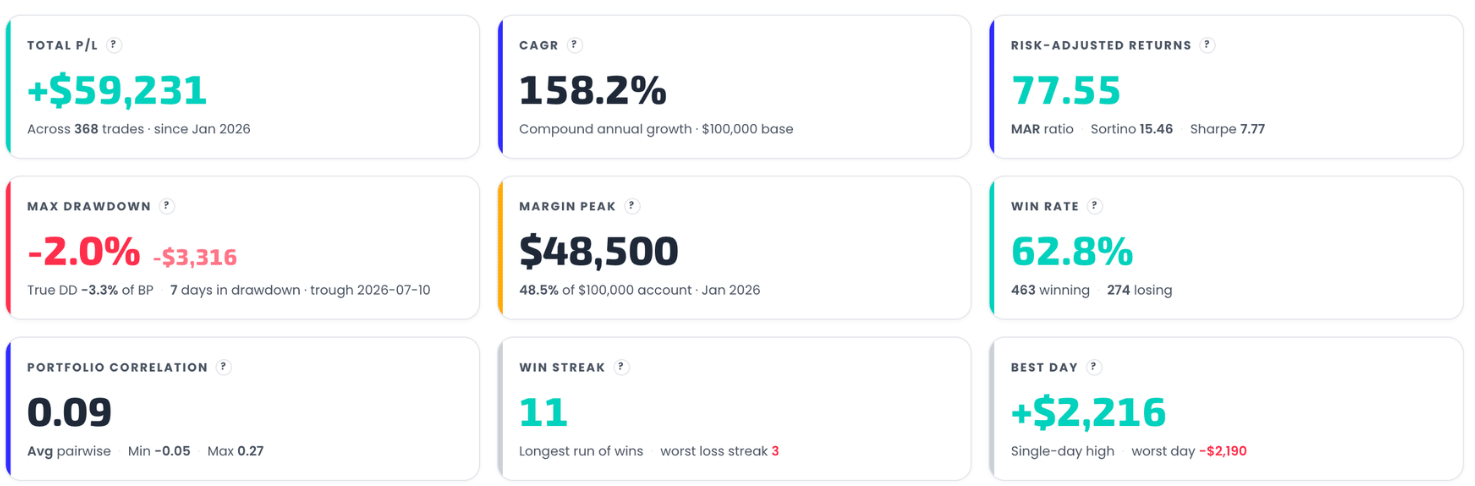
The nine KPI cards explained: Total P/L, CAGR, MAR, Max Drawdown with True DD, Margin Peak, Win Rate, correlation, streaks and daily extremes.
The Portfolio Metrics grid is the portfolio-level truth: all nine cards are computed from the combined daily equity of your enabled strategies at their contract counts, over the active period. Disabled rows don't exist as far as these cards are concerned.
Returns row

- Total P/L — the sum of net P/L across all enabled strategies over the window, with the trade count and window start underneath. The per-strategy Total P/L values (visible as a column in the composition table) sum exactly to this card.
- CAGR — compound annual growth rate of the combined equity, on your account-size base. This is the compounded figure — typically higher than the composition footer's weighted average, because gains across strategies stack.
- Risk-Adjusted Returns — MAR (CAGR ÷ Max Drawdown) as the hero number, with Sortino and Sharpe alongside for context. MAR is the single best one-number summary of "return per unit of pain" for this construction.
Risk row

- Max Drawdown — the hero % is the deepest peak-to-trough decline measured against the running equity peak; the $ value restates it in dollars. The sub-line adds True DD — that same dollar drawdown as a % of your account size — plus how many days the portfolio spent in drawdown and the trough date. True DD is the number to sanity-check against your own pain threshold: it's what your account statement would have shown.
- Margin Peak — the largest single-day margin the portfolio used, in $ and as % of your account, with the month it happened. If this is near 100%, the construction has no headroom on its worst margin day.
- Win Rate — winning spread-legs ÷ total legs over the period (a both-sided iron condor is two per day), with the win/loss counts. Read it together with the stop-loss levels: high win rates with occasional capped losses is the expected shape for credit-spread portfolios.
Behavior row

- Portfolio Correlation — the average pairwise correlation between the selected strategies' daily returns, with the min and max pair. This is the diversification score of the construction: low average correlation is why a portfolio's drawdown can be shallower than its parts'.
- Win Streak — the longest run of consecutive winning days, with the worst losing streak alongside. Useful expectation-setting: you will live through the loss streak too.
- Best Day — the single-day P/L extremes, best and worst. If the worst day number would make you abandon the system, the sizing is wrong regardless of every other metric.
All of it is hypothetical backtest output — evaluation material, not a projection. The same portfolio's distribution of outcomes is what Stress Testing is for.
Get the weekly 0DTE research email
Research notes and product updates, straight to your inbox. Unsubscribe anytime.