
Metrics & columns
Every catalog column explained — parameters, MAR, CAGR, max drawdown, win rate, Sharpe, Sortino, P&L and Confluence — plus sorting and the column picker.
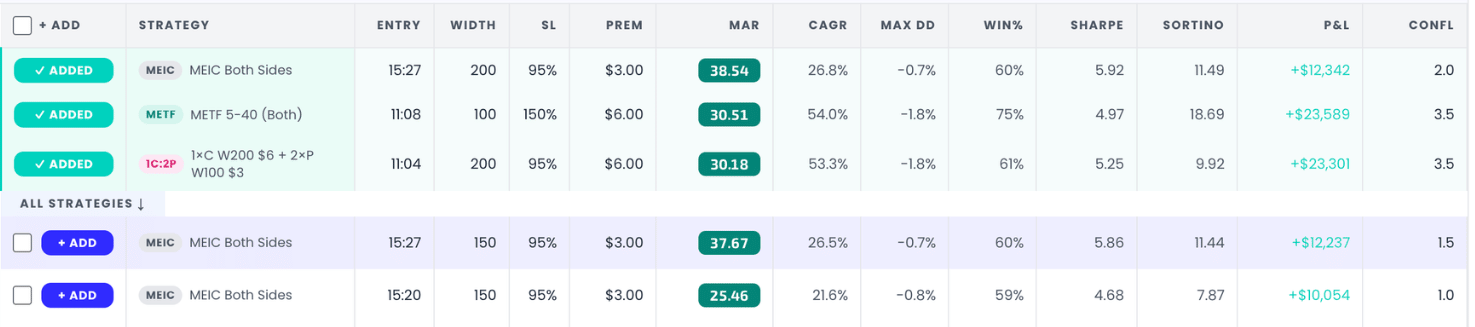
The Strategy Catalog is the results table. The header line tells you exactly what you're looking at: how many strategies match, how many are shown, what the table is sorted by, and the account size the buying-power gauge uses.

Parameter columns
| Column | Meaning |
|---|---|
| Strategy | Family badge + name. The row encodes the full parameter set: family, width, stop loss, premium, entry time. |
| Entry | Entry time of day (ET) the position is opened. |
| Width | Spread width in points — distance between short and long strikes. |
| SL | Stop loss, as a percentage of the credit received. |
| Prem | Target premium (credit) collected per spread, in dollars. |
Performance columns
All performance columns are computed over the selected period, per contract, on a standardized $100,000 account.
| Column | Meaning |
|---|---|
| MAR | CAGR ÷ Max Drawdown — return earned per unit of drawdown. The badge color grades it: roughly, ≥2.5 excellent · ≥2.0 good · ≥1.5 okay · below that weak. |
| CAGR | Compound annual growth rate over the period. |
| Max DD | Maximum drawdown — the deepest peak-to-trough decline over the period. |
| Win% | Per-trade win rate: winning spread-legs ÷ total legs. A both-sided iron condor counts as two trades per day, one per side. |
| Sharpe | Mean daily P/L ÷ standard deviation of daily P/L — return per unit of total volatility. |
| Sortino | Mean daily P/L ÷ downside deviation — like Sharpe, but penalises only losing-day volatility. |
| P&L | Total net P/L over the period, for one contract on the standard $100k account. |
| Confl | Confluence (0–5) — neighbourhood robustness. Explained in depth in Min Thresholds. |
Why both Sharpe and Sortino: a strategy that lurches upward (big win days) gets punished by Sharpe for volatility you'd happily accept. Sortino ignores upside volatility, so comparing the two tells you whether a low Sharpe is about risk or just about lumpy wins. For the full treatment of these metrics — including where they break for options sellers — see Sharpe, Sortino, Calmar, MAR.
Sorting
Click any column header to sort by it; click again to flip direction. The catalog shows the top rows of the sort (the header says how many) — matches, not painted rows, are what exports and + Add all operate on. One honest note that the app itself makes: the ordering reflects only the statistic you sort by — it isn't a recommendation, and with this many variants the top of any sort partly reflects selection bias. Confluence and longer periods are the antidotes.
The Columns picker
Columns (top right of the catalog) opens a picker where you can show, hide and drag-reorder columns. Your layout is remembered on this device. If a column described here isn't visible, it's toggled off — open the picker and re-enable it.
Simple and Advanced keep separate column layouts, so hiding a column in one does not disturb the other. Reordering is available in Advanced only.
Columns in Advanced view
Advanced adds the two-period metrics — wMAR, MAR Base, Relation, MAR / BP, Trades and a per-period twin of each metric — and renames the shared ones (plain MAR becomes MAR Ref · 26W). The definitions on this page still apply; only the window they are measured over changes. Full detail in wMAR & reference periods.
Get the weekly 0DTE research email
Research notes and product updates, straight to your inbox. Unsubscribe anytime.