
Results & history
How to read Hunter's results: candidates A–G, aligned vs. solver P/L, the opened portfolio, the exact-formulas panel, loading into the Builder, history and run comparison.
A finished run lands on the Results tab as up to seven rows — Candidate A through G. Candidate A is the exact optimum of your program; B–G are the next-best portfolios that are materially different from every row above them. Which candidate — and whether any of them — is up to you.
The results table
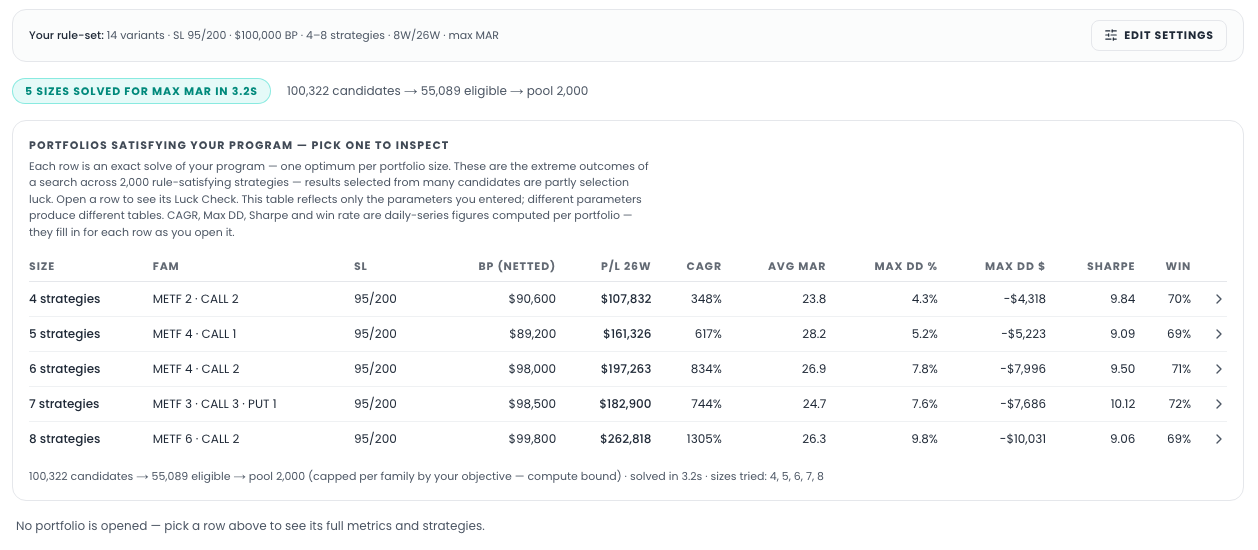
Above the table, a banner restates what you are looking at, verbatim:
Rule-compliant set: [n] portfolios in best-first solver-estimate order · fixed objective · buying power is a ceiling · [n] candidates checked
and the section's own introduction does the framing work: "Every row passes the same rule-set. Candidate A has the highest solver-estimated reference-period P/L; B–G are the next-best materially different compliant portfolios." If a rule made the search hard or empty, amber diagnostic cards appear here saying which — a diagnosis, not a shrug.
The columns, every one sortable: Size (strategy count plus the candidate
letter), Fam (family counts, e.g. MEIC 3 · METF 2), SL (stop-loss
levels in use), BP (netted), P/L over your reference period, CAGR,
Avg MAR, Max DD %, Max DD $, Sharpe, Win, Worst day
($ and % of BP), Best day, and Last hour (share of picks entering at
or after 15:00 ET).
Two of these deserve definitions:
- BP (netted) — call and put verticals on the same SPX 0DTE expiry are margined at the larger side only, since only one side can finish in the money, and both collected premiums reduce the requirement. The deployed buying power shown is that netted figure — the same basis the Portfolio Builder uses.
- P/L (aligned) — the headline P/L is the calendar-aligned portfolio figure, computed from one combined daily series exactly as the Builder and Portfolio Analytics compute it. The solver's internal per-strategy sum is printed underneath as "Solver estimate". When the two differ, the aligned figure is the one to trust — it is what the same portfolio will show everywhere else in the Workbench. CAGR, drawdown, Sharpe and win rate come from the same daily series and fill in as they are computed.
An opened candidate
Click a row to expand the full picture below the table.
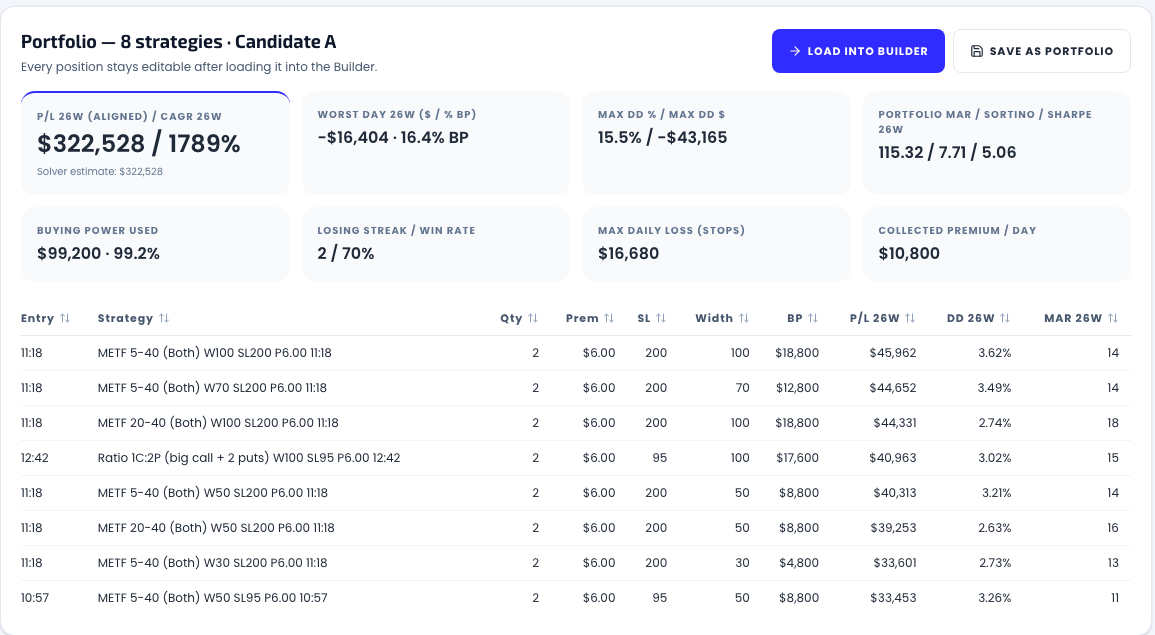
- KPI tiles — aligned P/L and CAGR (with the solver estimate noted underneath), worst historical day in $ and % of BP, max drawdown in % and $, portfolio MAR / Sortino / Sharpe, buying power used ($ and % of budget), losing streak and win rate, the theoretical max daily loss with all stops hit, and collected premium per day.
- The picks table — every strategy with entry time, name, quantity, premium, stop-loss, width, buying power, and its P/L, drawdown and MAR over the reference period. Sortable, like everything else.
The exact-formulas panel
Below the results, Exact formulas used expands to the server's own formula for each rule of your run — the selection objective, the buying-power ceiling, stop risk, the historical worst-day and simultaneous-stop caps, combined drawdown, correlation, premium bounds, last-hour and concentration rules. Nothing about the solve is proprietary or hidden: the program that ran is printed under the result it produced.

Into the Builder
Two actions per candidate, stated with the panel's own subtext — "Every position stays editable after loading it into the Builder":
- Load into Builder carries the picks and quantities into the Portfolio Builder and sets the Builder's account size to your buying-power budget. Because the P/L shown in Hunter is already the calendar-aligned figure, the numbers you saw are the numbers the Builder shows.
- Save as portfolio stores it directly under a name you choose.
Hunter's output is a starting point you own, not a finished product.
History
Selecting a candidate in Results automatically logs it to the History tab — no "save" step to remember (and the empty state says so: "No runs yet. Selecting a portfolio in Results logs it here."). Each row carries the run's timestamp, the matched saved-settings name if the rule-set corresponds to one, the rule-set summary, and the full KPI record: buying power, aligned P/L, CAGR, MAR, both drawdown figures, Sharpe, win rate, BP used, the simultaneous-stop total, worst historical day, combined DD, max correlation and last-hour share. All columns sort; the actions stay pinned while the wide table scrolls.
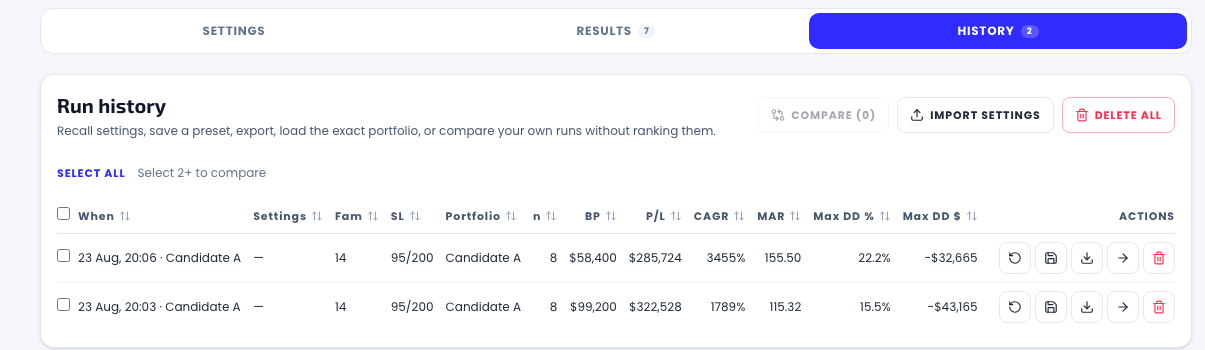
The five row actions
| Action | What it does |
|---|---|
| Recall settings | Loads that run's complete rule-set back into Settings, ready to tweak and re-run |
| Save settings as preset | Stores the rule-set under a name you choose, so it appears in the saved-settings bar |
| Export settings | Downloads the rule-set as a JSON file |
| Load into Builder | Sends that exact portfolio — picks and quantities — to the Portfolio Builder |
| Delete run | Removes the row (confirmed first, not undoable) |
Deleting in bulk works too: tick rows for Delete selected, or Delete all when nothing is ticked. Both confirm before acting.
Comparing runs
Tick at least two runs and press Compare. The view lines them up in two blocks:
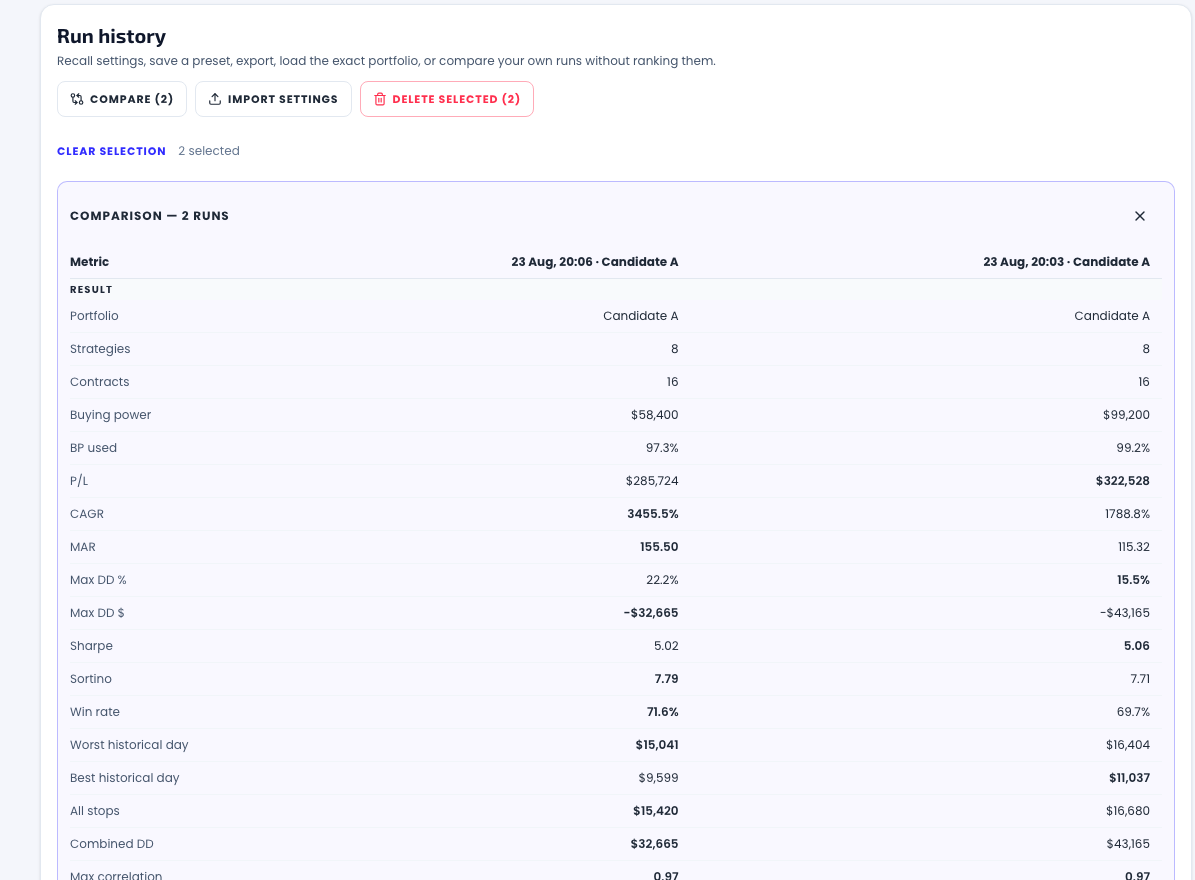
- Result — portfolio, strategies, contracts, buying power and BP used, aligned P/L, CAGR, MAR, Max DD in % and $, Sharpe, Sortino, win rate, worst and best historical day, the all-stops total, combined DD, max correlation and last-hour share — plus picks in common, which tells you whether two runs found genuinely different portfolios or shuffled the same ones.
- Rule-set — every setting from both runs, row by row, so the reason for a difference sits directly under the difference itself.
Teal marks each metric's extreme — highest P/L, lowest drawdown, and so on — and the footer states the limit plainly: "Teal marks each metric's best extreme; no overall winner is assigned." Nothing in Hunter will tell you which run was "best", because that judgment depends on what you are optimizing for — which is the thing you defined in the first place.
Saved settings: named, portable, reproducible
The bar above the Settings form holds "Your named Hunter 3.0 rule-sets":
- Save current names the rule-set on screen and adds it to the dropdown; with a set loaded, Update "…" overwrites it in place and Save as new forks it.
- Export writes the rule-set to a JSON file — a plain, readable record you can archive or send to someone. Import reads one back; a file that isn't a valid rule-set is rejected with a message rather than half-applied.
- Manage lists every saved set for loading or deleting, with a two-step confirm — and, as the dialog notes, "Deleting a set does not change the form you have open."
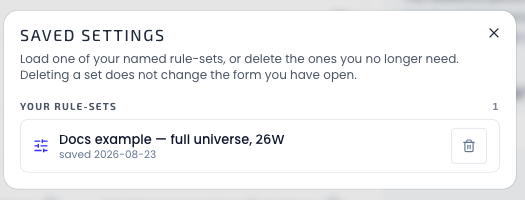
Because the file is the rule-set, an exported run is reproducible: import it, press Build portfolios, and you are solving exactly the program you solved before — against whatever the catalog looks like now, which is precisely how you find out whether a rule-set still holds up.
Note that Hunter 3.0's saved settings and history are its own: rule-sets and runs from the original Hunter stay with it at the legacy address.
Related pages
Get the weekly 0DTE research email
Research notes and product updates, straight to your inbox. Unsubscribe anytime.