
OOS Tracker
How the OOS Tracker scores every saved portfolio out-of-sample on the daily shadow — sessions after your last edit, at your saved contracts — and how to read the record.
The OOS Tracker answers a question no backtest can: what did my saved portfolio do after I built it? Every saved portfolio is a frozen selection. Every daily shadow session that completes after the portfolio's last edit is out-of-sample (OOS) by construction — the selection could not have known about it. The tracker scores those sessions at your saved contract counts and shows the record, per portfolio and per strategy.
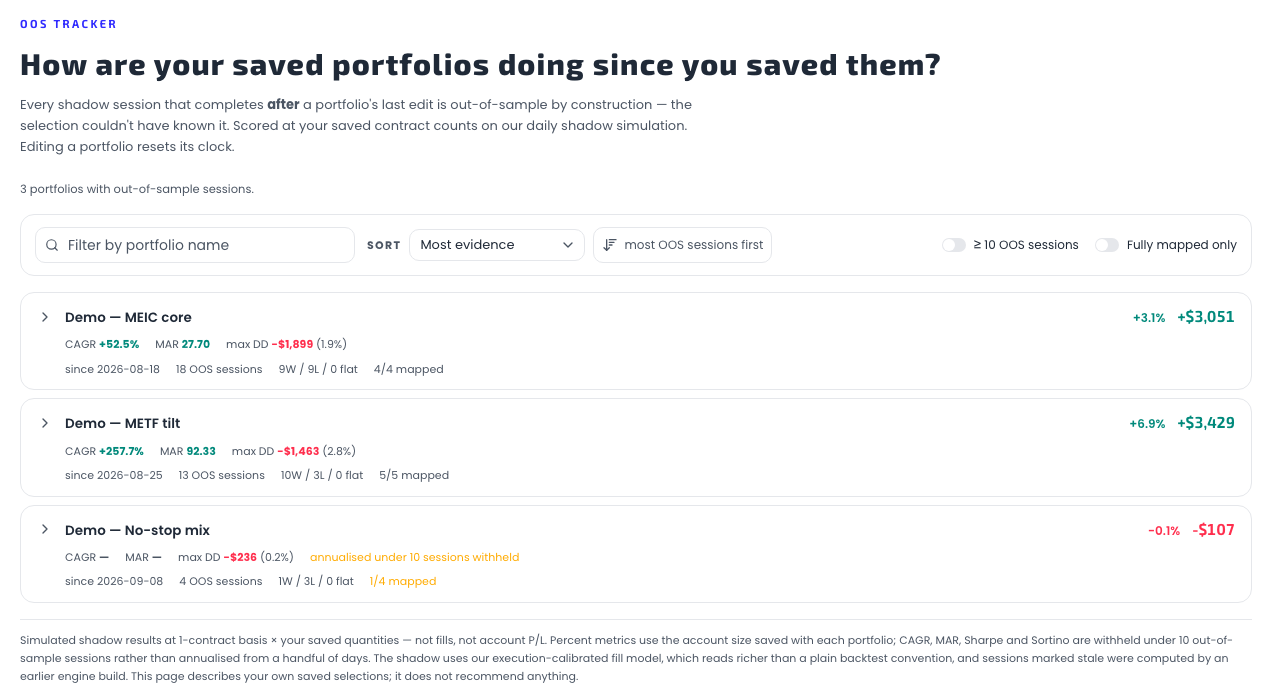
You find it under Portfolios → OOS Tracker. It is available on every plan. There is nothing to configure: saving a portfolio in the Portfolio Builder starts tracking it automatically.
Why "out-of-sample" matters
Every number in the Strategy Browser and the Portfolio Builder is in-sample for the portfolio you build from it: you selected strategies by looking at their history, so their history flatters your selection. The Builder's Luck Check grade says as much on its own card: it is measured on the same window you could see when choosing, so there is no window the ranking never used.
The tracker fixes the reference point instead of the data. Your portfolio's last edit is the cutoff. Sessions on or before it are in-sample. Sessions strictly after it are holdout: the same strategies, the same quantities, scored on days that did not exist when you chose them. Editing a portfolio resets its clock — P/L after an edit is out-of-sample for the new composition only, so the record starts again from the edit.
Where the numbers come from
Each trading day, our shadow simulation runs the whole strategy universe on that day's second-level data, with the same execution-calibrated fill model that feeds Reality Check. The tracker reads those per-strategy daily results and sums them:
session P/L = Σ (your saved quantity × the strategy's 1-contract shadow P/L that day)
Three consequences follow, and the page states all three:
- A flat day is a real day. A session where none of your strategies entered (their entry rules kept them out) counts as $0, not as a gap. Win rate and daily mean include it; the annualised metrics do not skip it.
- Unmapped picks contribute $0. A pick with no shadow-universe mapping
(for example an uploaded Mine strategy) is listed as unmapped — not
scored, and the card shows mapped as
5/6. The portfolio is still tracked; that strategy is simply absent from the record. - Simulated, not fills. These are shadow results at 1-contract basis × your saved quantities — not your account P/L, not executed trades. The shadow's fill model reads somewhat richer than a plain backtest convention, and it is stated on the page.
Reading a portfolio card

Each card is one saved portfolio. The header row carries the portfolio name, its return on account and its out-of-sample P/L. The line beneath shows the headline account-basis metrics — CAGR, MAR and max drawdown with its percent — and the third line the evidence behind them:
| Item | Meaning |
|---|---|
| since | The cutoff date: the day of the portfolio's last edit. Sessions strictly after it are OOS. |
| N OOS sessions | Completed shadow sessions after the cutoff — the sample size behind every number on the card. |
| W / L / flat | Winning, losing and flat plan days in the OOS window. |
| mapped | Picks with a shadow-universe mapping ÷ enabled picks. Anything below full coverage is highlighted. |
| stale-engine | OOS sessions still pinned to an earlier engine build; they disappear as the daily lane reruns them. |
A — in place of a metric is not an error: it means the metric is withheld, and the Metrics page explains exactly when. A portfolio saved or edited too recently — no completed session after the edit yet — is counted in the line above the list and appears once its first OOS session lands.
Opening a portfolio
Tap a card to open it. Three things unfold:

The cumulative P/L chart. One point per OOS session, flat days plotted flat, with the zero line drawn so a dip below the start is visible at a glance.
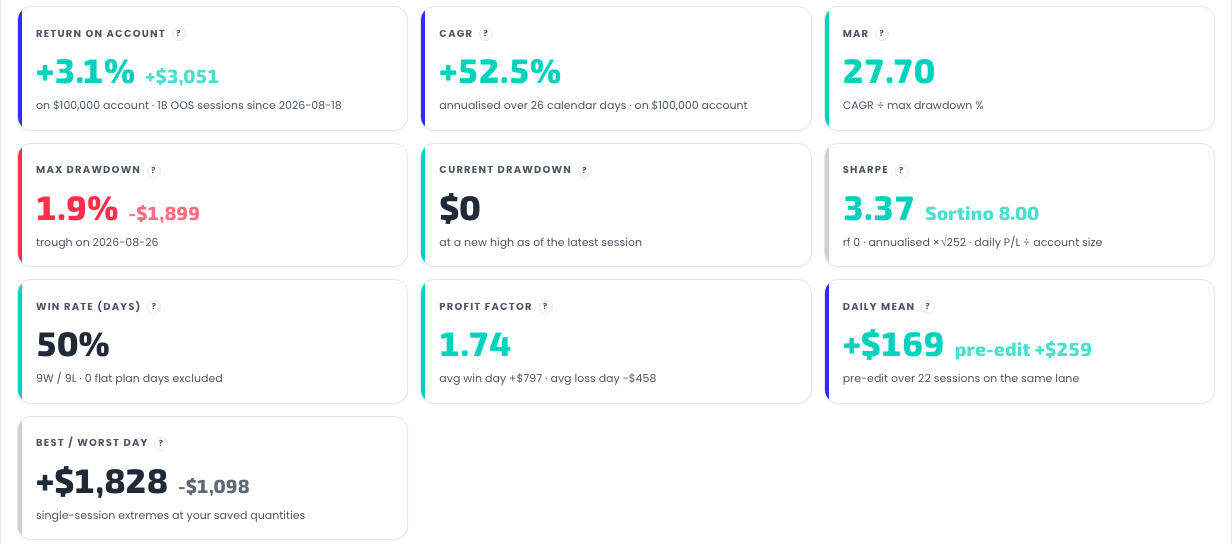
The KPI grid. Ten cards, each with its formula behind the ? badge and
a sub-line that says either what it was computed on or why it is blank.
Every one of them is defined on the Metrics page.

Per strategy (OOS). How each pick contributed: quantity, sessions entered, winning and losing sessions, average P/L per entered session, and its OOS P/L at your quantity. Rows are ordered by the size of their contribution, either sign. Unmapped picks sit in the list marked as not scored, so the portfolio's composition is never hidden.
What the tracker is not
- It is not a recommendation. The page describes what your own saved selection did afterwards. It does not rank your portfolios against each other beyond the sort you choose, and it never suggests changing one.
- It is not a long record yet. Tracking started in September 2026, and a portfolio's clock starts at its last edit. Expect thin windows at first; the annualised metrics stay withheld until a portfolio has 10 OOS sessions precisely so that two weeks of data are not dressed up as a track record.
- It is not your broker statement. No fills, no commissions you actually paid, no slippage you actually took. For live-versus-modeled comparison of executed trades, that is what Reality Check is for.
Related pages
Get the weekly 0DTE research email
Research notes and product updates, straight to your inbox. Unsubscribe anytime.