
Metrics & withheld values
Every OOS Tracker metric with its exact formula — return on account, CAGR, MAR, drawdown, Sharpe, Sortino, win rate, profit factor — and the rules for when a value is withheld.
Every metric on the OOS Tracker ships with its formula behind the ? badge
on its card, and every blank is explained on the card that carries it. This
page collects those definitions in one place. The account-basis metrics use
the Portfolio / catalog conventions — the same formulas the Portfolio
Builder's Analyze tab uses — applied to the out-of-sample shadow series, so a
number here is directly comparable to the same number there.
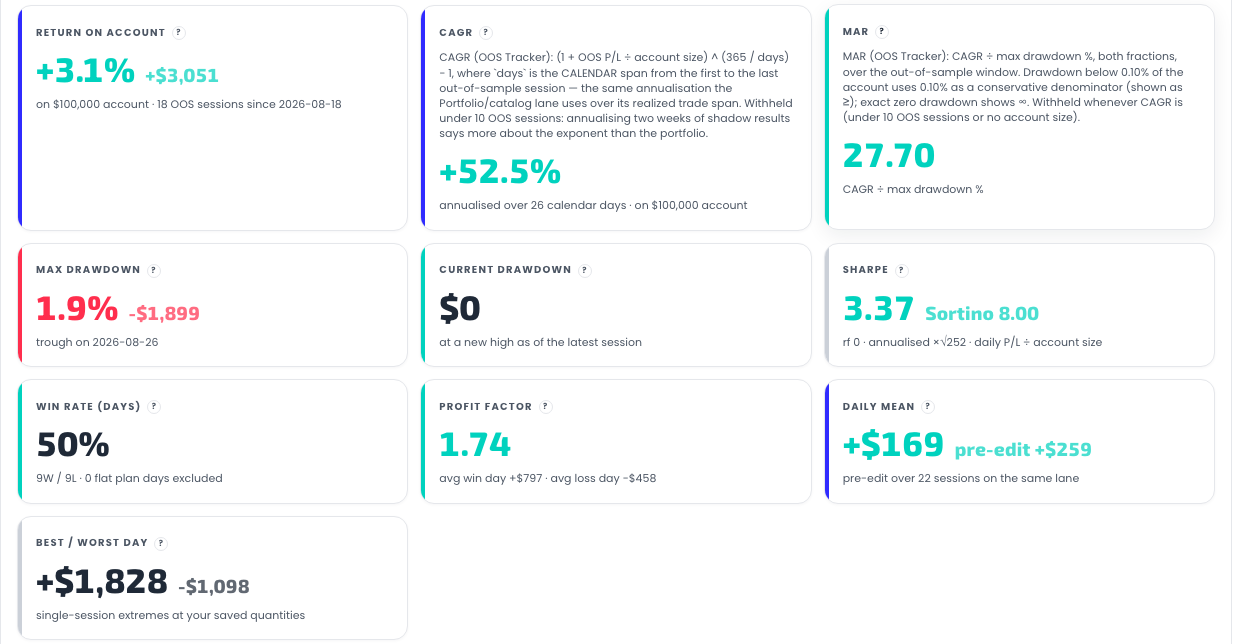
The basis: your saved account size
Percent metrics need a capital base. The tracker uses the account size you
saved with the portfolio in the Portfolio Builder — nothing is inferred from
elsewhere, and nothing is read from a broker. The Return on account card
prints that base (on $100,000 account) so the denominator is never a
mystery.
A portfolio saved without an account size has no basis. Its dollar metrics (P/L, max drawdown in dollars, best and worst day) are unaffected; every percent and ratio metric is withheld and the card says withheld — no account size saved with this portfolio.
The evidence floor: 10 OOS sessions
CAGR, MAR, Sharpe and Sortino are annualised or ratio statistics. Computed on four sessions they say more about the exponent than about the portfolio, so the tracker does not show them under 10 out-of-sample sessions — roughly two calendar weeks. The card prints the current count (withheld under 10 OOS sessions (4 so far)) and fills in on its own once the floor is reached. The same floor drives the ≥ 10 OOS sessions switch on the Filter & sort bar.
Return on account
Formula: cumulative OOS P/L ÷ saved account size.
Simple, not compounded: the running total of every OOS session's P/L (flat days as $0) divided by the fixed base. The dollar P/L sits beside it on the card. Withheld only when there is no account size.
CAGR
Formula: (1 + return on account) ^ (365 / days) − 1, where days is the
calendar span from the first to the last out-of-sample session.
This is the Portfolio / catalog annualisation — over the realized span, not a trading-day count. A 12-session window that spans 15 calendar days is annualised over 15 days. The sub-line names the span (annualised over 26 calendar days). Withheld under 10 OOS sessions or without an account size.
CAGR over a short window is volatile by nature, and the floor only removes the absurd cases. Treat a three-week CAGR as what it is: the current pace, not a track record.
MAR
Formula: CAGR ÷ |max drawdown %|.
Both terms are fractions over the same OOS window. Two disclosures, both inherited from the Strategy Browser's MAR convention:
- A drawdown below 0.10 % of the account uses 0.10 % as the denominator, and the value is shown as ≥ — a near-zero drawdown would otherwise turn MAR into a division blow-up.
- Exactly zero drawdown shows ∞ (the sub-line reads no drawdown yet in the OOS window).
Withheld whenever CAGR is. The card's colour stripe follows the value: teal at 1.0 and above, blue between 0 and 1, coral below zero.
Max drawdown
Formula: largest peak-to-trough decline of account size + cumulative OOS P/L, as a percent of the running peak at the trough.
The equity model is additive (no compounding), the opening balance counts as the first peak, and the card shows the dollar figure beside the percent plus the session on which the trough was hit (trough on 2026-09-03). The dollar drawdown and its date never depend on the account size; only the percent does, so a portfolio without an account size shows the dollars and notes that the percent is withheld.
Current drawdown
Formula: cumulative OOS P/L − its running peak, as of the latest completed session.
Where the curve sits today. $0 means the last session set a new high; a
negative figure is how far below the high-water mark the portfolio currently
sits. Always available.
Sharpe and Sortino
Sharpe: mean ÷ sample standard deviation of daily OOS P/L ÷ fixed account size, annualised × √252, risk-free rate 0.
Sortino: the same mean ÷ the sample standard deviation of only the negative daily returns, about their own mean, annualised × √252.
These are the Portfolio / catalog statistics on the shadow series. Both are withheld under 10 OOS sessions or without an account size; Sortino is also withheld with fewer than two losing days, because there is no downside dispersion to measure — the card says so.
Win rate (days)
Formula: winning days ÷ (winning + losing days).
Day-level, not per trade. One number per shadow session across all strategies at your quantities: a session whose net P/L is positive is a win. Flat plan days are excluded from the denominator — a day the plan did not trade is neither a win nor a loss. The sub-line prints the raw counts (11W / 6L · 1 flat plan day excluded).
Profit factor
Formula: Σ winning days ÷ |Σ losing days|.
Undefined — shown as — — until there has been at least one losing day. The sub-line carries the average winning day and average losing day that go into it.
Daily mean, and the pre-edit reference
Daily mean: average P/L per out-of-sample session, flat plan days included as $0.
Beside it, the card shows the pre-edit figure: the same computation over the sessions on or before the portfolio's last edit, on the same shadow lane. That is the in-sample reference for this exact composition — the number the selection was, in effect, made on. It is withheld under 5 pre-edit sessions.
A gap between the two is information about this selection. It is not a verdict: a portfolio can trail its pre-edit mean for weeks and be perfectly within its own historical dispersion.
Best / worst day
The single highest and lowest session P/L in the OOS window, at your saved quantities. Always available once there is one OOS session.
Per-strategy rows
Below the grid, each pick shows its quantity, sessions entered, winning and losing sessions, average P/L per entered session and its OOS P/L, all × your quantity. Entered means the strategy's own entry rules let it trade that session — a session it sat out is not counted against it. Unmapped picks show unmapped — not scored.
Withheld, at a glance
| Metric | Needs account size | Needs 10 OOS sessions | Other condition |
|---|---|---|---|
| Return on account | yes | no | — |
| CAGR | yes | yes | span ≥ 1 calendar day |
| MAR | yes | yes | — |
| Max drawdown % | yes | no | dollars and date always shown |
| Current drawdown | no | no | — |
| Sharpe | yes | yes | non-zero dispersion |
| Sortino | yes | yes | at least two losing days |
| Win rate (days) | no | no | at least one win or loss |
| Profit factor | no | no | at least one losing day |
| Daily mean | no | no | pre-edit reference needs 5 pre-edit sessions |
| Best / worst day | no | no | — |
Related pages
Get the weekly 0DTE research email
Research notes and product updates, straight to your inbox. Unsubscribe anytime.