
Daily Log & Trade Log
See the trajectory, not just the total: a per-day log of equity, P/L and drawdown for the selected portfolio, plus a per-trade breakdown of every position it took. Both exportable as CSV.
The KPI cards tell you where a portfolio ended — total P/L, max drawdown, the best and worst single day. They don't tell you how it got there. The two logs below the Analytics charts fill that gap: the Daily Log is one row per trading day, the Trade Log is one row per trade.
Both follow the period selector at the top of the Builder. Change the analysis window and both logs re-scope with everything else on the page.
Daily Log
"What did the trajectory actually look like, day by day?"
A small chart above a per-day table. The chart has two modes, toggled in the header:
- Equity — the cumulative equity line, i.e. the shape of the account over the window.
- Daily P/L — the same series as per-day bars, green for up days, coral for down days. This is the one that shows rhythm: clusters of small wins broken by the occasional larger loss.
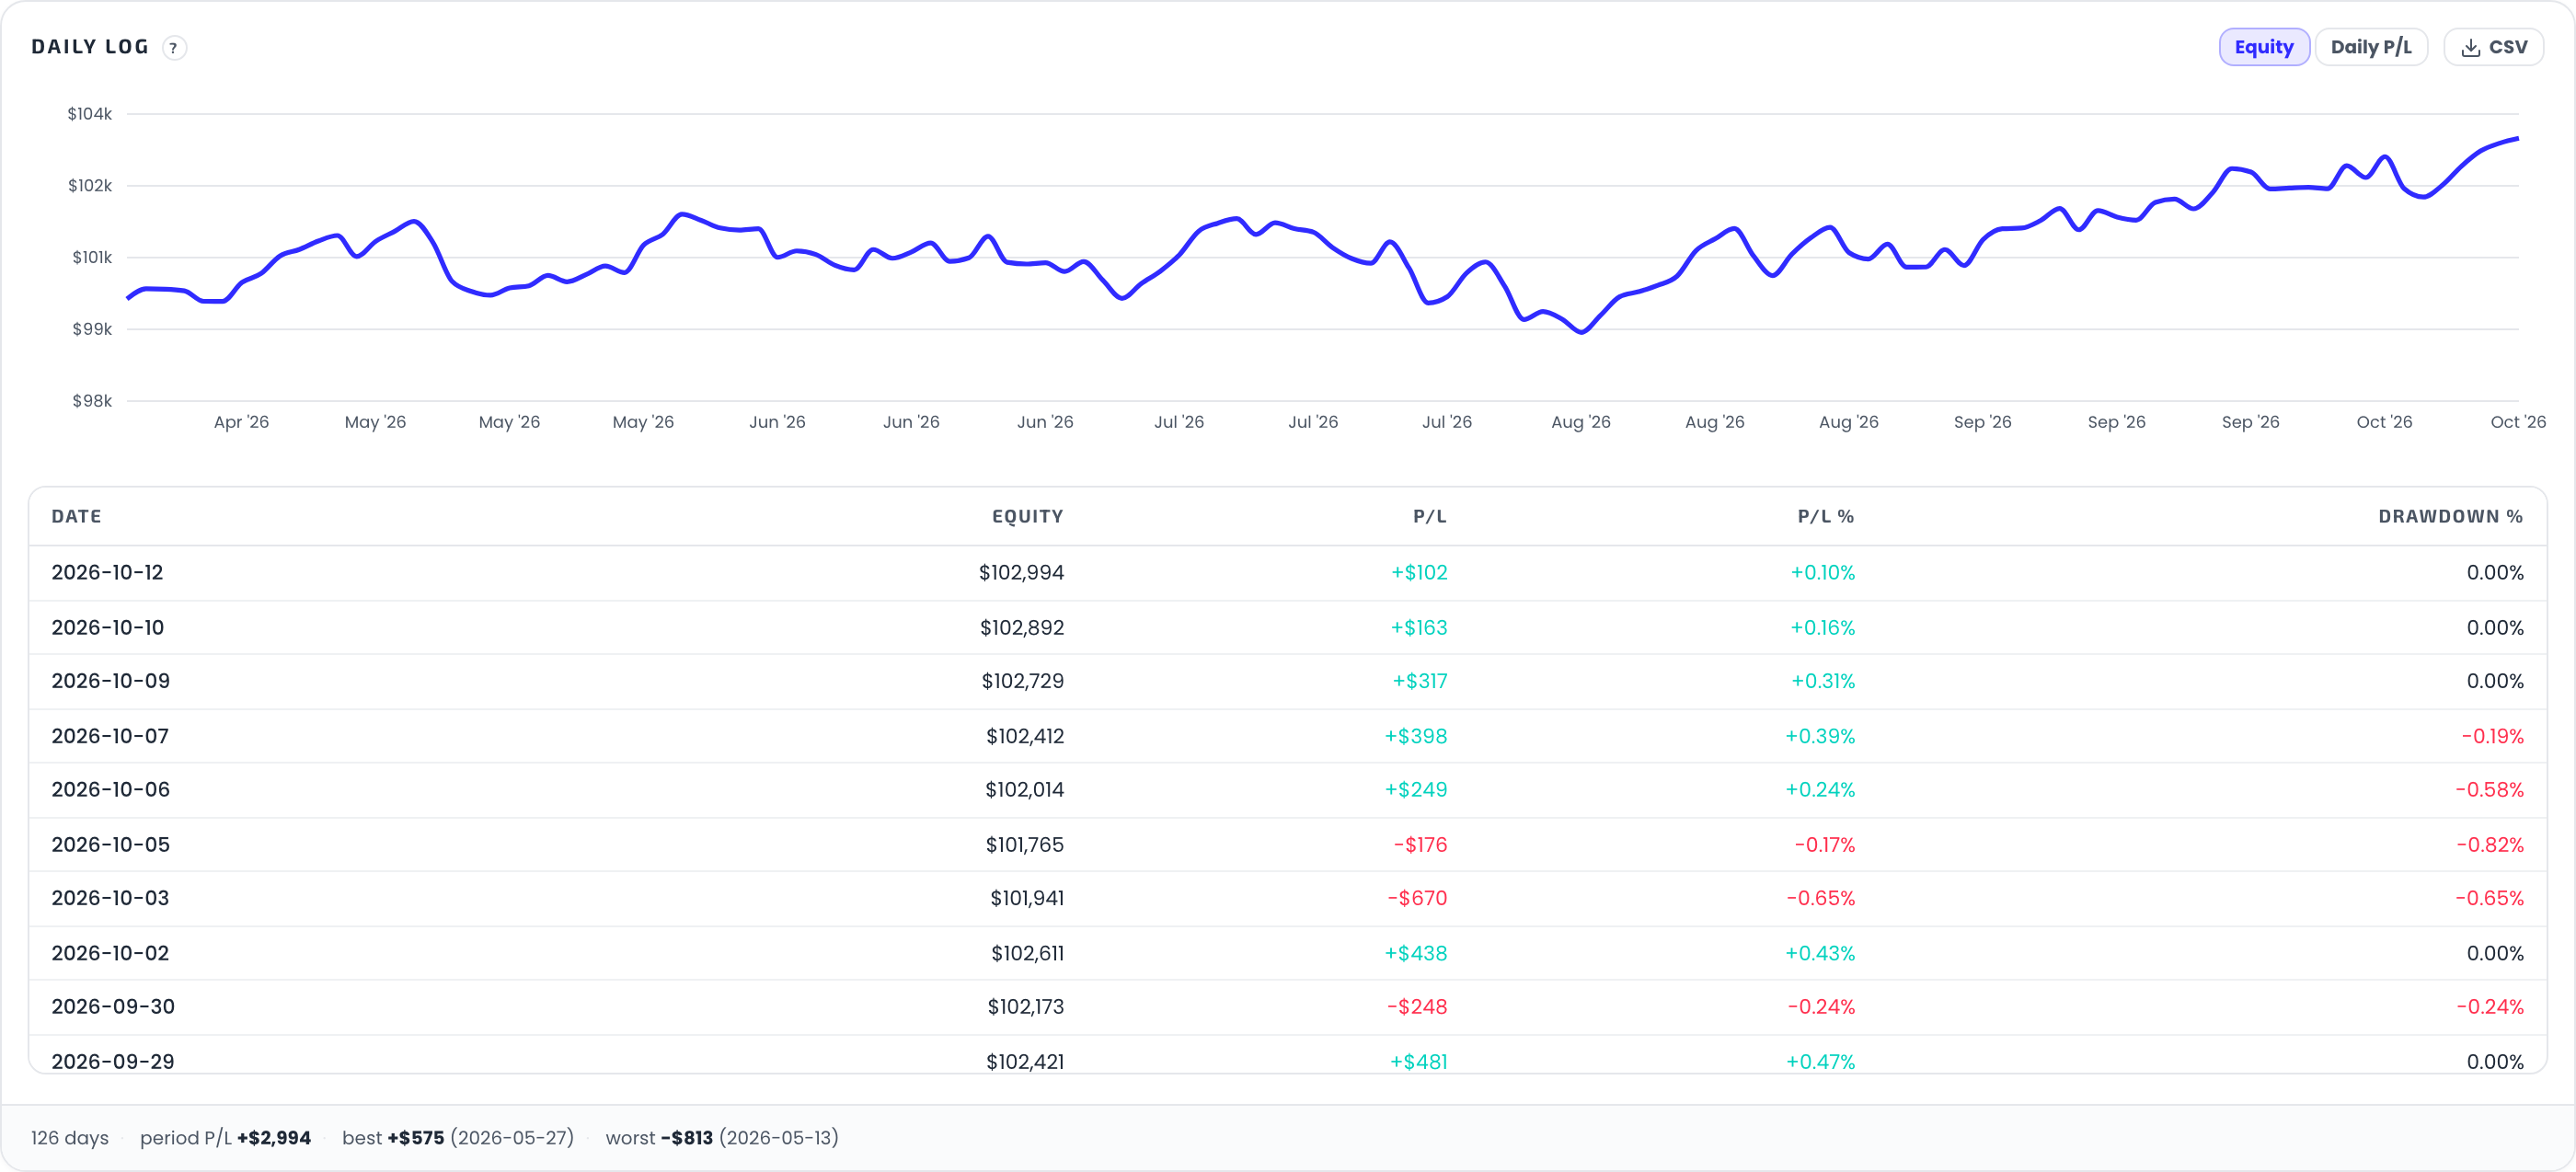
Switching to Daily P/L keeps the same days and re-draws them as bars:
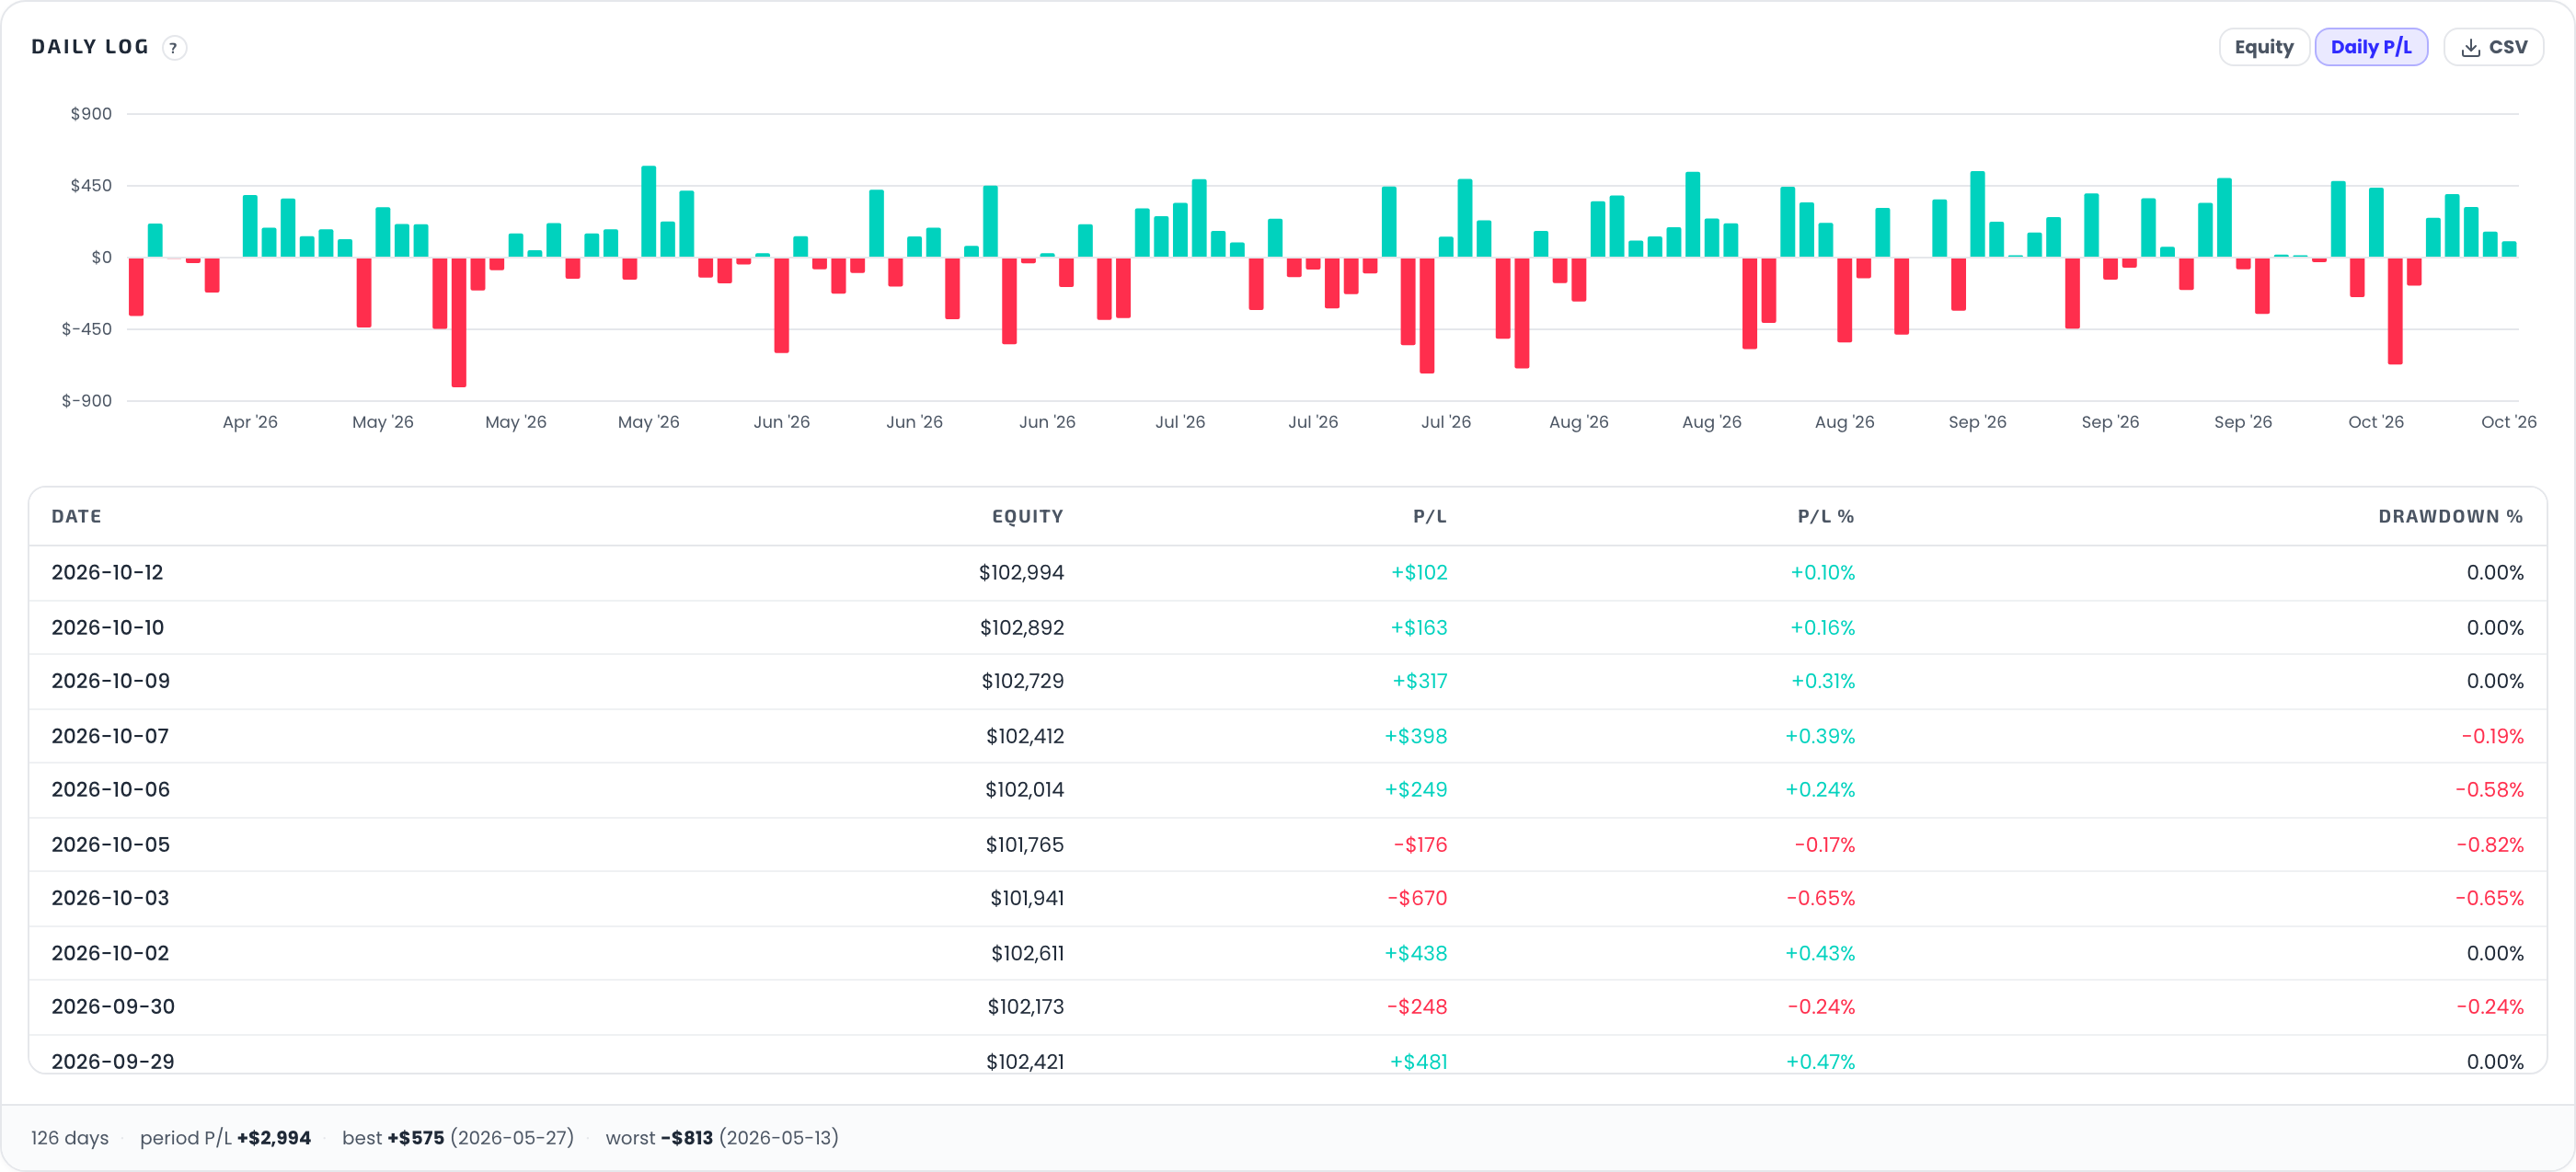
The table underneath lists every trading day, newest first:
| Column | What it is |
|---|---|
| Date | The trading day (ET). |
| Equity | Cumulative account value at the day's close — your account size plus P/L to date. |
| P/L | What that single day made or lost, in dollars. |
| P/L % | That day's P/L as a percentage of the equity it started from (the previous day's close). |
| Drawdown % | How far below the running equity peak the day closed. 0.00% means the day set or held a new high. |
| TORQ | The day's TORQ gamma-index reading, shown beside the day's result for context. Deliberately neutral — never colored by sign, because a toned value would read as a judgment. Joined by date only, and empty when a reading isn't available. See TORQ in the glossary. |
The footer summarises the window: how many days it covers, the period P/L, and the best and worst day with their dates.
Days with no data render an em-dash (—) rather than a zero, so a gap in the
series is visible as a gap.
Trade Log
"Which individual trades produced that curve?"
The Trade Log sits below the Daily Log and is collapsed by default — click it open. It loads on demand, so it only queries when you actually ask for it.
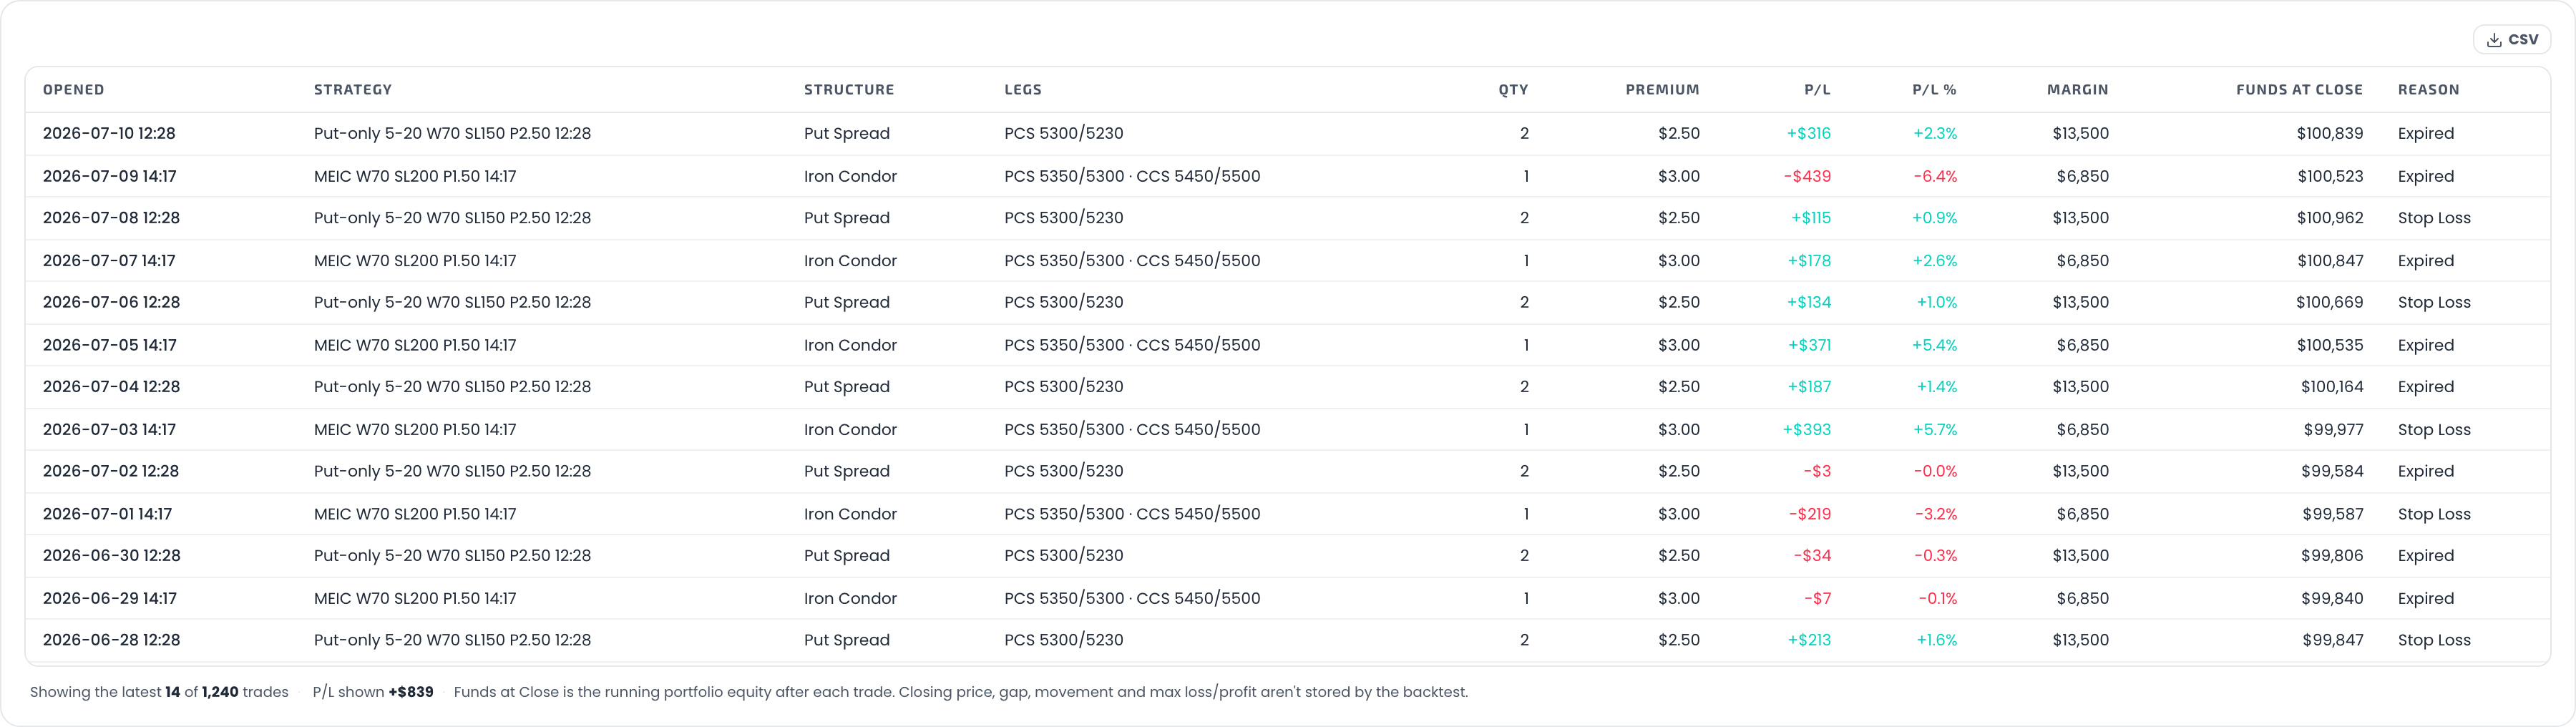
One row per trade, newest first:
| Column | What it is |
|---|---|
| Opened | Date and entry time of the trade. |
| Strategy | Which strategy in the portfolio took it. |
| Structure | Iron Condor, Put Spread or Call Spread — derived from the sides actually traded that day. |
| Legs | The short/long strikes per side, e.g. PCS 5350/5300 · CCS 5450/5500. |
| Qty | Contracts, i.e. the strategy's quantity in your portfolio. |
| Premium | Credit collected for the trade. |
| P/L | Result in dollars, already scaled by your contract quantity. |
| P/L % | Return on the trade's margin requirement. |
| Margin | Defined-risk requirement — (width − premium) × 100 × contracts. |
| Funds at Close | Running portfolio equity after that trade. |
| Reason | How the trade ended (expiry, stop loss, …). mixed means the two sides of a condor ended differently. |
A MEIC day trades both sides, and the log folds those two credit spreads into one Iron Condor row with the summed P/L and both legs listed. An EMA-gated METF or single-side strategy only trades one side on a given day, so it shows as a single Put or Call Spread.
Long windows can run to thousands of trades, so the view shows the most recent
1,000 and says so in the footer (Showing the latest 1,000 of 4,312 trades)
rather than silently truncating.
What the Trade Log does not show
Two honest limits, both stated in the interface:
- Composed ratio structures have no per-trade rows. A ratio variant is assembled from single-side atoms (one big spread against two small ones), so there is no single backtested "ratio trade" to list. Those strategies are excluded from the Trade Log with a note — they still appear in the Daily Log and in every portfolio metric.
- Closing price, gap, movement and max loss/profit are not available. The backtest data does not store them, so those columns are omitted rather than estimated.
Exporting both logs
Each log has a CSV button in its header. The file contains the same rows you see, with two deliberate differences:
- Raw values, not display formatting. Dollars are plain numbers, percentages
are fractions (
0.0047, not+0.47%), and timestamps are full ISO. It opens in Excel, Numbers, orpandas.read_csv()without cleanup. - Chronological order (oldest first), so
equityandfunds_at_closeread as running series even though the on-screen tables show newest first.
If the Trade Log is showing a capped set, the export contains those same rows — the button title tells you how many of how many you are downloading.
Each exported file also carries the standard hypothetical-performance note in its final rows, because a file that leaves the app travels without the disclosure shown in the interface.
Both logs describe what a configuration would have done over historical data. They are analysis output, not a forecast.
Get the weekly 0DTE research email
Research notes and product updates, straight to your inbox. Unsubscribe anytime.