
Strategy Browser
The Strategy Browser is the front door to the database: filter the backtested SPX 0DTE catalog down to a shortlist and send it to the Portfolio Builder.
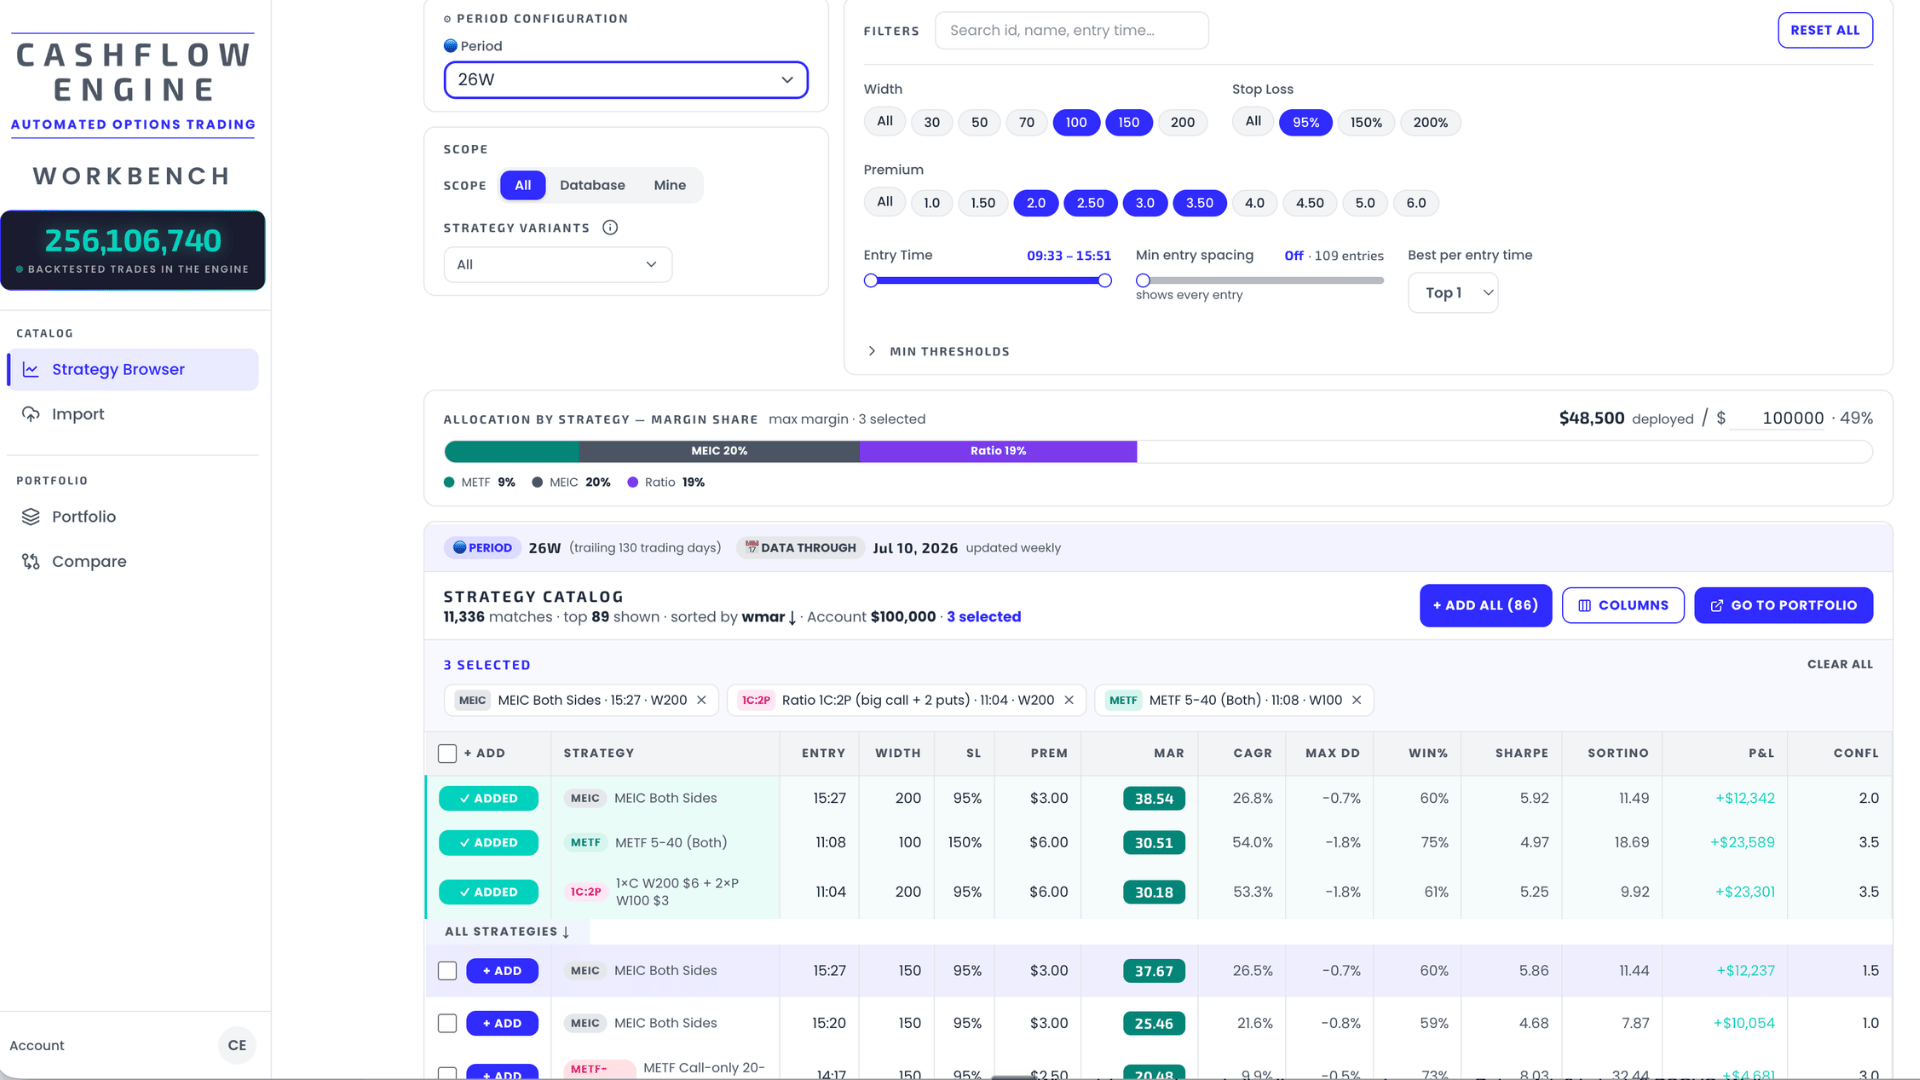
The Strategy Browser is where every portfolio starts. It shows the full catalog of backtested SPX 0DTE strategy variants — MEIC, METF, ratio spreads and more — with pre-computed performance metrics, and gives you three tools to narrow it: the period configuration, the filters, and the Min Thresholds.
Simple and Advanced views
Everything in the Browser comes in two levels of detail. The switch sits in the header of the Period Configuration panel, top left, and is labelled Simple and Advanced.
Simple is the default. It measures everything over one period, calls the headline metric MAR, and shows a core set of columns. It is a complete tool on its own — most of this documentation describes it, and you can build, size and export a portfolio without ever leaving it.
Advanced measures over two periods at once — a shorter base window and a longer reference window — and adds the metrics that compare them: wMAR, Relation, per-period column twins, and the threshold sliders that filter on each period separately.
| Simple | Advanced | |
|---|---|---|
| Periods | one | base and reference |
| Headline metric | MAR | wMAR (a weighted blend of both periods' MAR) |
| Period controls | one selector | two selectors + a Base Weight slider |
| Columns | core set | adds wMAR, MAR Base, Relation, MAR / BP, Trades and per-period twins |
| Thresholds | one slider per metric | paired Base/Ref sliders, plus Min wMAR and Min Relation |
The switch changes how much is shown, not what you are allowed to do. It does not unlock features, change your plan, or alter any strategy's underlying data — the same catalog is being described either way. Your choice is remembered in that browser.
It reaches past the Browser. The same setting also governs the
Deep Dive panel (its charts relabel
to wMAR and rank the cohort at your base weight) and two surfaces in the
Portfolio Builder: the
MAR < 1.00 chip on composition
rows, and the
Risk Contribution panel in
Analytics. All of them are display, not entitlement.
Which to use. Start in Simple. Move to Advanced when you want to ask a specific question it answers: did this strategy's recent performance hold up against its longer-term record? That comparison is the entire point of the second period, and wMAR & reference periods explains it end to end.
One caveat worth stating plainly: a second period gives you more ways to sort and filter the same fixed set of 270,000+ backtested variants. More slicing of a fixed dataset means more opportunity to find patterns that are noise. Advanced is a sharper instrument, not a more accurate one.
The layout
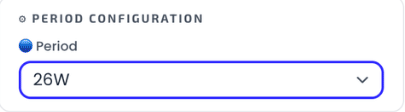
- Period Configuration (top left) — which slice of history all metrics are computed over. See Period, scope & variants.
- Scope & Strategy Variants (below it) — whose strategies you're looking at (database, your own imports, or both) and which strategy families.
- Filters (top right) — narrow by the strategies' parameters: width, stop loss, premium, entry time. See Filters.
- Min Thresholds (collapsible, under the filters) — narrow by the strategies' results: minimum MAR, CAGR, win rate and more. See Min Thresholds.
- Allocation bar — a buying-power gauge for what you've selected so far. See Account size & margin.
- Strategy Catalog — the results table. Every column is explained in Metrics & columns.
One thing to know before reading any number in the table: every metric is normalized to a standard $100,000 account, per contract, so strategies compare like-for-like. Your own account size affects the buying-power gauge and the Portfolio Builder's dollar figures — not the catalog metrics.
Adding strategies to a portfolio
Every row has a + Add button; added rows flip to ✓ Added and appear in the selected-strategies panel above the table, where each pick shows as a chip you can remove again.

- + Add on a row adds or removes a single strategy.
- Tick the checkboxes on several rows and + Add selected (n) adds just those.
- + Add all (n) bulk-adds every strategy that matches your current filters — useful after you've filtered hard.
- Go to Portfolio jumps to the Portfolio Builder with your selection.
The Deep Dive panel
Below the catalog, the Deep Dive · Cohort Shape panel describes the group of top strategies matching your filters — entry-time distribution, robustness scatter, quality curve, and parameter heatmaps. It's the fastest way to tell a real pattern from a lucky row. Fully explained in The Deep Dive panel.
Related pages
Get the weekly 0DTE research email
Research notes and product updates, straight to your inbox. Unsubscribe anytime.