
Walk-forward validation
Hunter's out-of-sample check: replay your exact rule-set at past re-selection points, hold each result to the next one, and see how much survived.
Every number on a Hunter result row is optimized on its own window — by construction it looks good there. The walk-forward panel answers the only question that matters after that: how much of it would have survived out of sample?
What a replay does
Inside any opened result row, the panel replays your exact rule-set at each past re-selection point, using only data available then, re-solves it at that row's portfolio size under your own sizing rules, and holds each result until the next re-selection — the same rhythm the tool is actually operated on. The held periods are stitched end-to-end into one continuous out-of-sample curve: what your account would have traced running this exact program, never using data from the future. Only days after each selection date count.
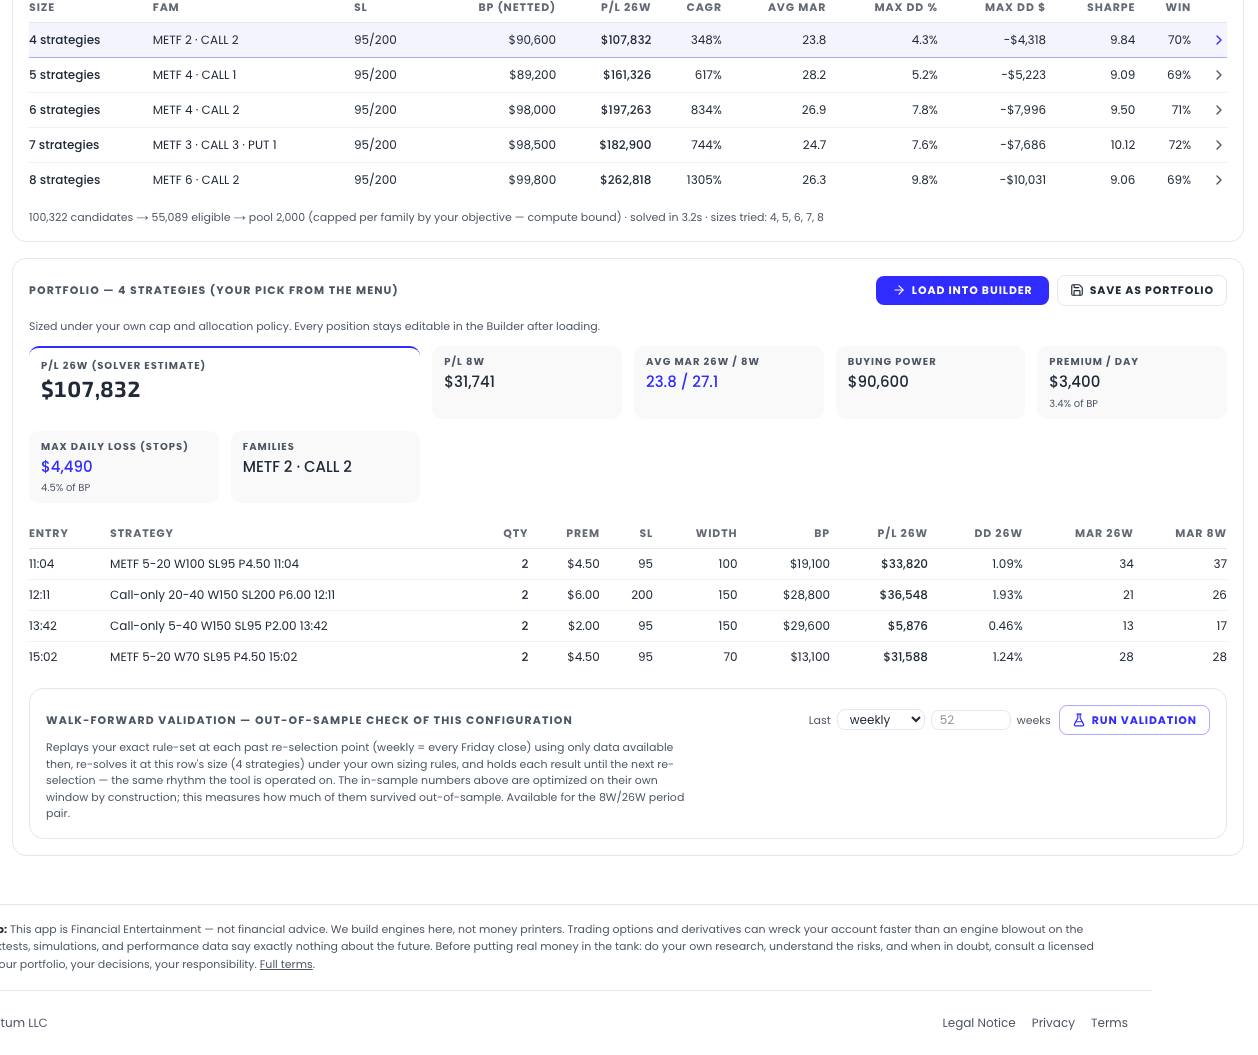
Two controls, then Run validation:
- Re-selection cadence — weekly (every Friday close — the default and the live cadence) or monthly (last Friday of each month).
- Validation span — how many recent re-selections to cover: 4–156 weeks or 2–36 months, defaulting to 52 weeks / 12 months. Longer spans cover more market regimes and take longer; a replay runs 1–5 minutes with live progress.
One availability limit, stated in the panel: the anchored history the replay reads is precomputed for the 8W/26W period pair only. A run with other windows shows exactly that message and asks you to re-run with 8W/26W to validate. If you left the eligibility filter off — so you never chose a base window — a 26W reference run still qualifies: the panel mirrors the same substitution the backend makes, rather than refusing a validation the server would happily accept.
Walk-forward efficiency
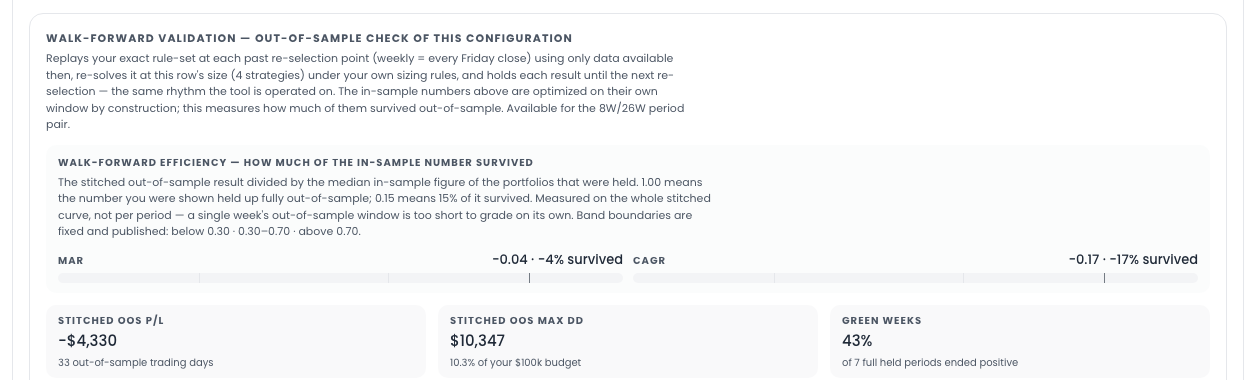
The headline metric — WFE — is the stitched out-of-sample result divided by the median in-sample figure of the portfolios that were held, reported for both MAR and CAGR. 1.00 means the number you were shown held up fully out of sample; 0.15 means 15% of it survived. It's measured on the whole stitched curve, not per period — a single week's window is too short to grade on its own.
The bands are fixed and published, not tuned per result: below 0.30 · 0.30–0.70 · above 0.70. And the panel's own words about the coloring apply: "Color states a measured survival band, not a recommendation."
What else the panel reports
- Stitched OOS P/L and max drawdown — the out-of-sample totals, drawdown also as a share of your budget.
- Green weeks/months — the share of fully-held periods that ended positive. Labeled in the product as "a frequency, not a forecast."
- Re-selections solved — at how many past points your rule-set actually produced a portfolio at this size. Infeasible points held nothing and show up as flat stretches, not as silently skipped data.
- The DD-cap record — if you set a combined-DD cap, the panel counts how many fully-held periods exceeded it out of sample: "The cap shapes the in-sample curve; it is not a forward guarantee." This is the measured version of the warning on the cap itself.
- A stitched equity chart, monthly P/L bars, and a per-re-selection table (in-sample vs out-of-sample MAR, WFE, P/L, drawdown per anchor) — with explicit status text when an anchor solved nothing, so gaps are explained rather than smoothed over.
The caveats, quoted
The panel closes with its method line, which ends on the sentence any walk-forward tool should be forced to print:
An out-of-sample measurement of the past is still the past — it assumes the market regime persists and is not adjusted for the number of configurations you tried before this one.
Read together with the Luck Check, the posture is consistent: Hunter grades its own output, states the grade's limits, and leaves the decision where it belongs — with you.